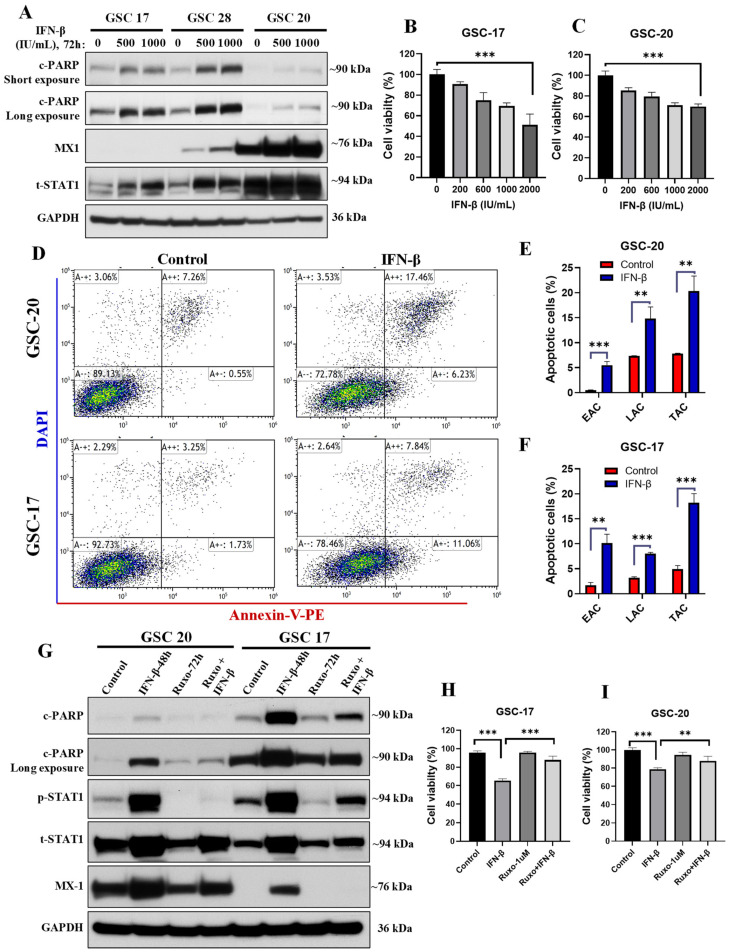
Figure 5.
IFN-β exposure induced apoptosis in GSCs with high basal IFN/STAT1. (A) Representative WB of c-PARP and IFN/STAT1 signaling WCLs of GSCs treated with IFN-β (500–1000 IU/mL) for 72 h. Original blots see Figure S9. (B,C) Cell viability of GSCs treated with IFN-β (200–2000 IU/mL) for 72 h. (D–F) Apoptosis analysis by flow cytometry in GSCs treated with IFN-β (1000 IU/mL) for 48 h. EAC: early apoptotic cells, LAC: late apoptotic cells, TAC: total apoptotic cells. (G) Representative WB of apoptosis and IFN/STAT1 signaling in WCLs of GSCs treated with ruxolitinib (1 μM) for 24 h before IFN-β (1000 IU/mL) exposure for 48 h. Original blots see Figure S9. (H,I) Cell viability of GSCs treated as mentioned in (G). *** p < 0.001 and ** p < 0.01 compared to untreated cells.

