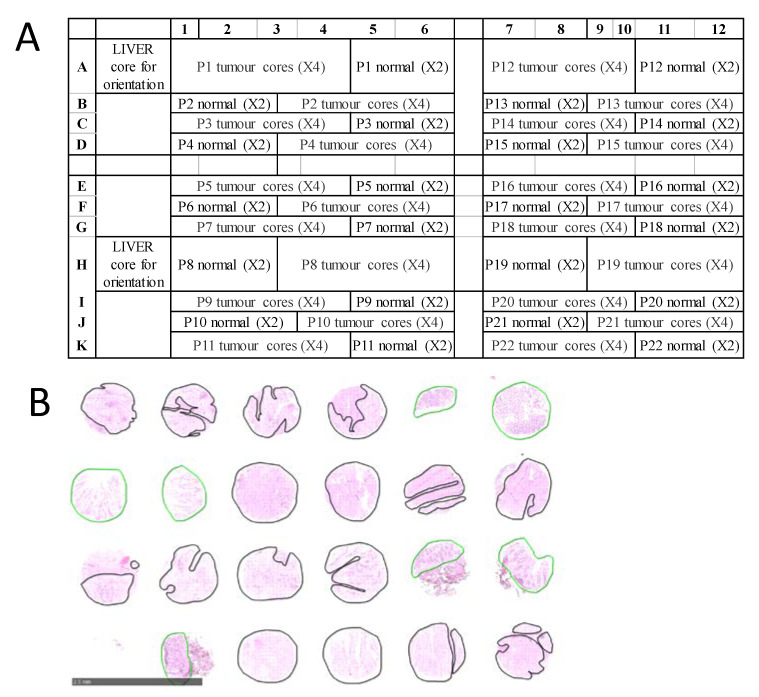
Figure 1.
Example CRC TMA. (A) TMA layout, each patient has six tissue cores (two ‘normal’ and four ‘tumour’). For example, the cores for patient 1 are placed in Row A, columns 1 to 6. (B) Representative zoomed in annotated CRC TMA cores post MALDI MSI, with pathologist annotated regions outlined in green (normal tissue) or black (tumour tissue). Scale bar is 2.5 mm.

