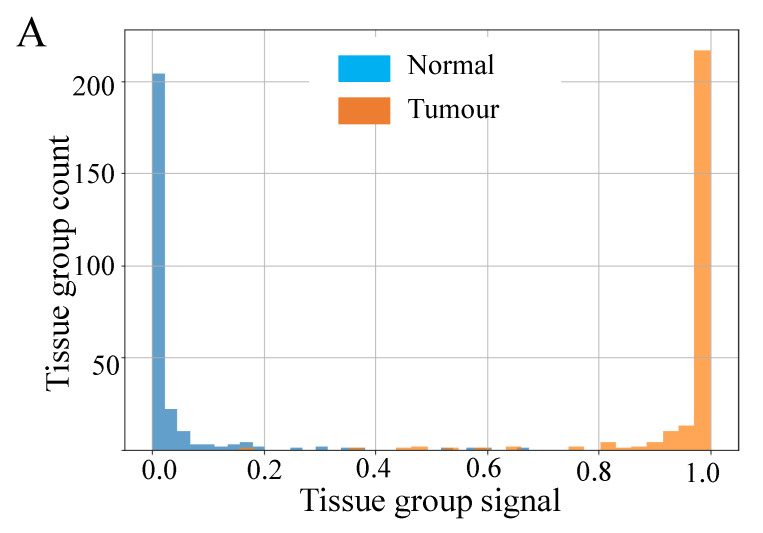
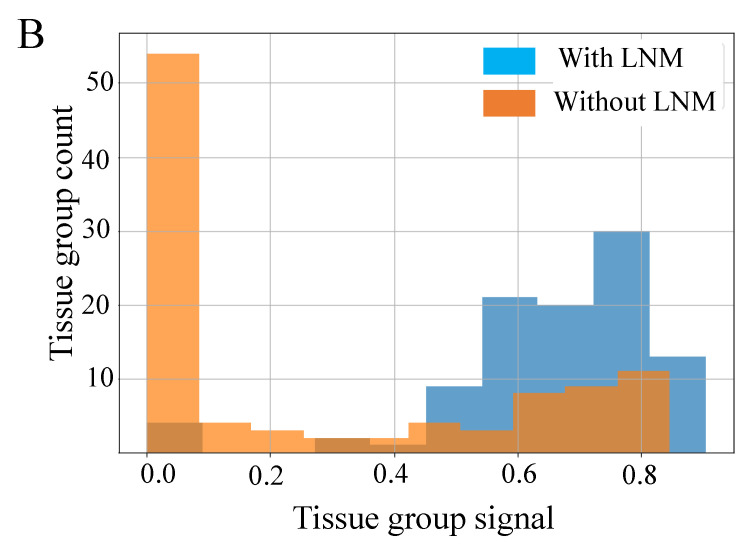
Figure 5.
Histograms of the classifier signal produced by the final design for per-tissue-group classification for CRC (A) and EC (B). For CRC, the blue histogram is for normal tissue groups, and orange is tumour tissue groups. For EC, the data is aggregated over all 10 validation folds; the blue histogram is for LNM, and orange is for non-LNM samples.


