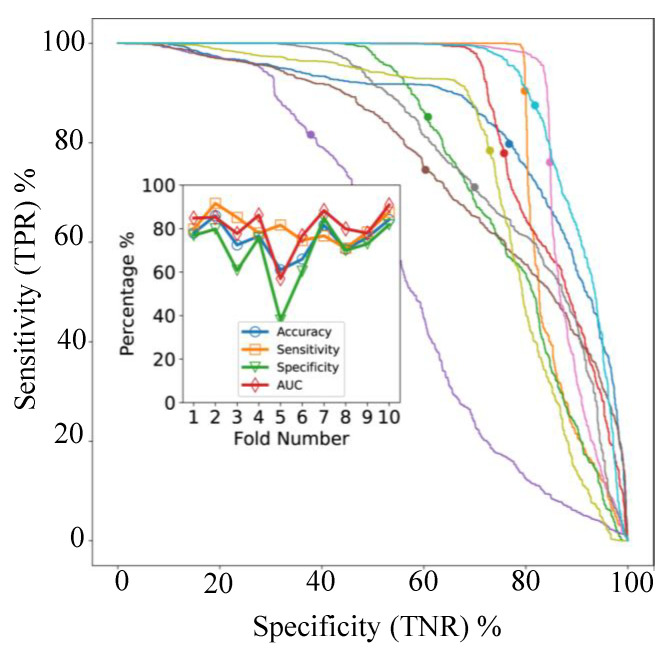
Figure 6.
Endometrial cancer: 10-fold cross-validation results for per-spectra classification. The main figure shows the ROC-AUC curves (true positive rate (TPR) vs. true negative rate (TNR) for each fold. The solid circle on each curve shows the operating point for a classification threshold of 0.5. The total area under the curve (AUC) for each TMA is shown in the inset, along with the corresponding accuracy, sensitivity, and specificity. The different colors of the ROC-AUC curves indicate different cross-validation folds. The lines joining markers in the inset are a guide to the eye.

