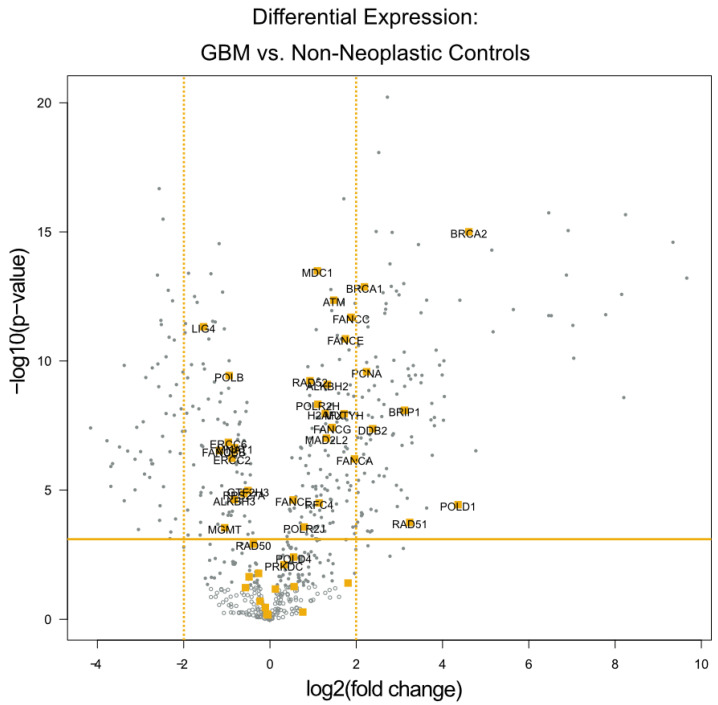
Figure 1.
Differential Expression of Individual DNA Damage Repair Genes. A volcano plot of differentially expressed genes with the genes categorized by the NanoString software as being related to DNA damage repair highlighted in orange. The x-axis displays the fold change in DE laterally, while the y-axis displays decreasing p values vertically. The orange horizontal line depicts the p-value threshold of 0.01, and the orange vertical lines depict the 4-fold change threshold used to identify the most dysregulated DNA damage repair genes.

