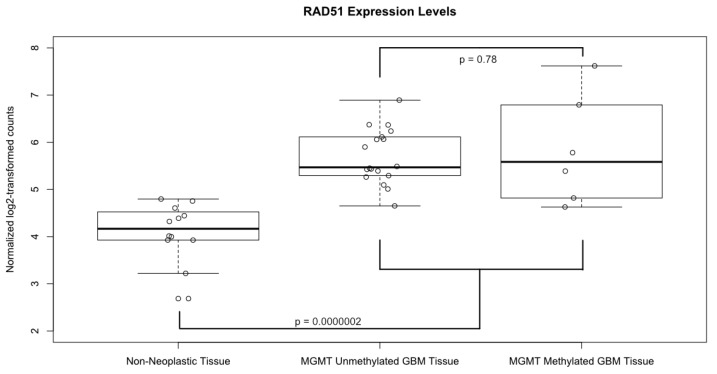
Figure 3.
Expression levels of RAD51. Boxplot comparing the normalized, log2 transformed, RAD51 expression levels between GBM tissue samples, both MGMT methylated and unmethylated, and non-neoplastic controls. Solid horizontal lines represent the median value of each group; boxes show interquartile range (25–75th percentiles), while whiskers show the range of values contained within 1.5 times the interquartile range. Values from each individual sample are superimposed as hollow circles.

