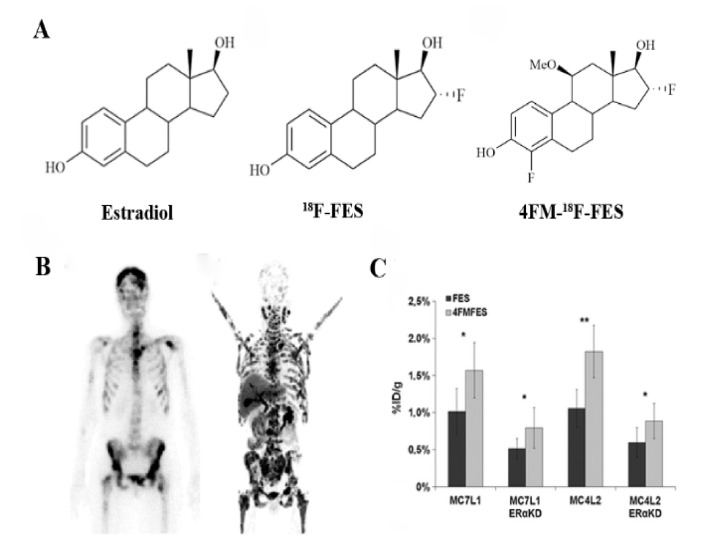
Figure 5.
(A) chemical structure of ERα receptor probes marked by 18F. Estradiol (E2), 18F-FES, and 4FM-18F-FES; (B) image of the bone scan (left) and 18F-FES PET (right) of a patient after multiple lines of anti-hormonal therapy and chemotherapy [172]; (C) biodistribution data of MC7-L1 and MC4-L2 (ER+ and ERαKD, respectively) tumor uptake for FES and 4FM-18F-FES [169]. * p < 0.05; ** p < 0.01.

