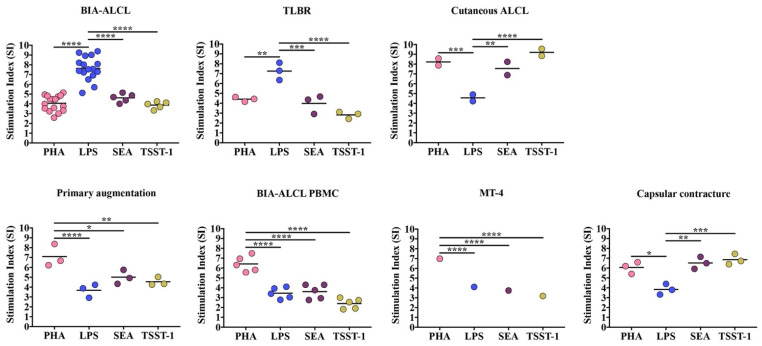
Figure 1.
Maximum proliferative response as stimulation index (SI) of primary BIA-ALCL tumor cells (n = 16), TLBR (n = 3), and cutaneous ALCL cell (n = 2) lines, PBMC purified from primary augmentation (n = 3), BIA-ALCL (n = 5), and contracture (n = 3) patients, and MT-4 cells following 72-h stimulation with LPS, PHA, SEA, and TSST-1, measured using an MTT assay. Each dot represents one cell line with six replicates and the mean SI is indicated by the horizontal line. Significance at * p < 0.05, ** p < 0.01, *** p < 0.001, **** p < 0.0001.

