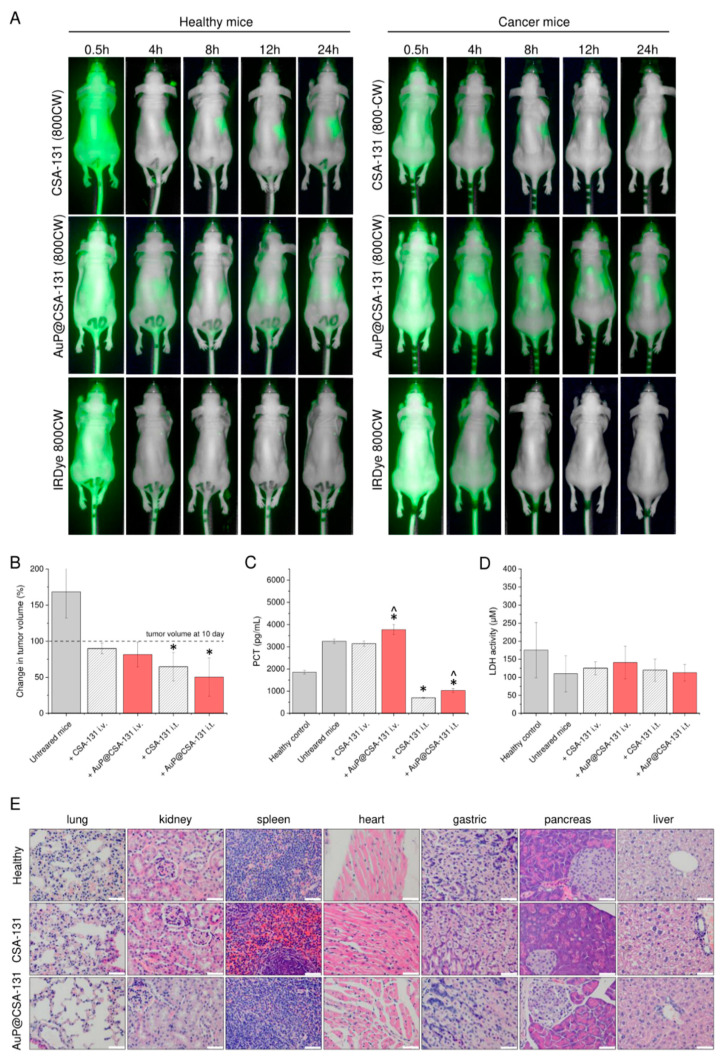
Figure 5.
Biodistribution of exogenously administered CSA-131 labelled with IRDye® 800CW (CSA-131 (800CW)), AuP@CSA-131 labelled with IRDye® 800CW (AuP@CSA131 (800CW)) and unmodified IRDye® 800CW dye estimated by fluorescence-based analysis of fluorescence signal in healthy and cancer-bearing animals (A). Changes in volume of tumors collected from untreated animals and mice treated with CSA-131 (stripped grey bars) or AuP@CSA-131 (red bars) administered intravenously or intratumorally when compared with day 10 (beginning of treatment) (B). Concentrations of procalcitonin (PCT) and lactate dehydrogenase (LDH) recorded in serum of sacrificed animals (C,D), respectively. Histological analysis of the main organs of healthy animals as well as CSA-131 and AuP@CSA-131-treated animals carried out using hematoxylin–eosin staining (200×). White scale bar indicates 250 µm. Results from one representative experiment are shown. For (A,E), one representative result is shown. For (B–D), results are presented as mean ± SD from three experiments. * and ^ indicate statistical significance (p < 0.05) when compared with control, cancer-suffering animals (0 µg/mL) and CSA-131-treated mice, respectively.

