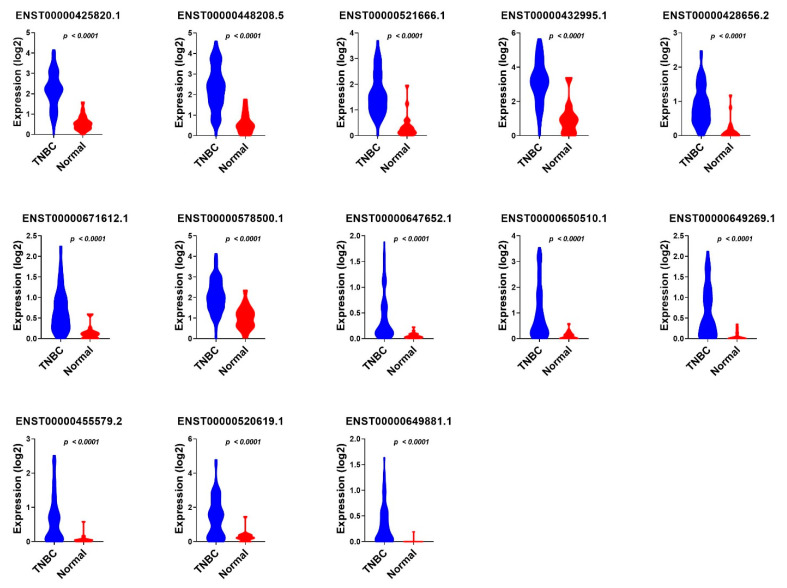
Figure 9.
The expression of 13 TNBC diagnostic lncRNA panels in TNBC compared to normal breast tissue samples from the PRJNA553096 cohort. The expression values (log2) from TNBC (n = 72) and normal (n = 19) from the second validation cohort are presented as violin plots with the Anova p value indicated on each plot.

