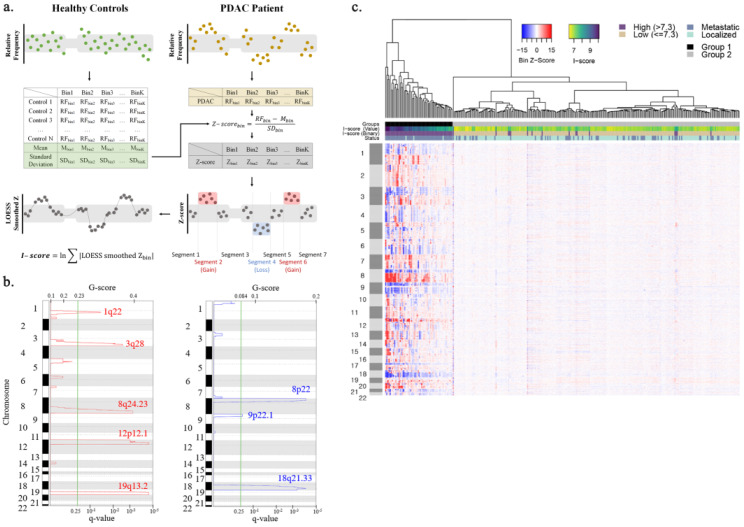
Figure 1.
Enriched amplification and deletion regions identified by cfDNA CNA analysis. (a) A schematic illustration of the I-score calculation. (b) Amplification (red) and deletion (blue) regions identified by GISTIC analysis. G-score and q-value are indicated on the upper and lower side of the x-axis. Cytoband information of each region is written on the y-axis. (c) Heatmap showing genome-wide CNV profiles of 315 patients. The top dendrogram shows that 315 patients are well divided into high and low I-score groups. The colored bar right above the heatmap indicates the clustering group, I-score, and tumor status for each patient. The color changes yellow to dark blue as the I-score increases.

