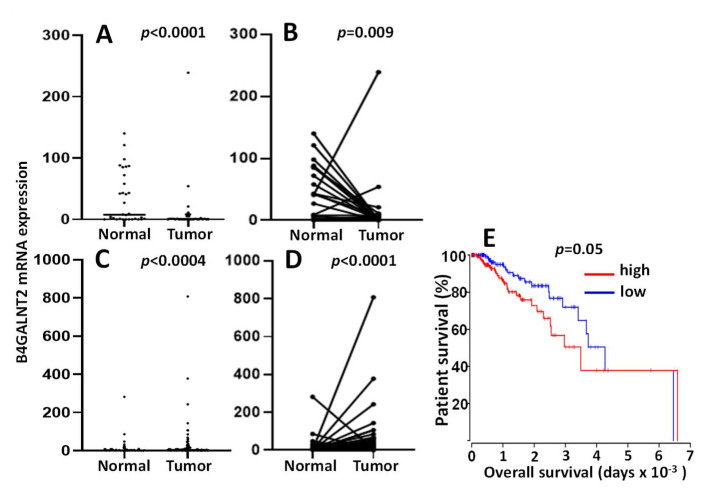
Figure 5.
B4GALNT2 mRNA in stomach adenocarcinoma (STAD) and breast cancer (BRCA) TCGA cohorts. In (A) and (C) plots, the unpaired distribution of B4GALNT2 expression in normal tissue and cancer samples of stomach (A) and breast (C) cancer patients is reported. In (B) and (D) graphs, B4GALNT2 distribution in paired normal and tumor tissues of stomach (B) and breast (D) cancer patients is reported. Stomach: 35 normal and 415 tumor samples; breast: 107 normal and 1100 cancer patients. Statistical analysis conducted by the Mann–Whitney test in A and C and by the Wilcoxon test in (B) and (D). (E): Kaplan–Meier survival curves of patients belonging to the groups of high expressers (15th upper percentile, red) or no expressers (15th lower percentile, blue) of mRNA B4GALNT2 as deduced from the Oncolnc.org website.

