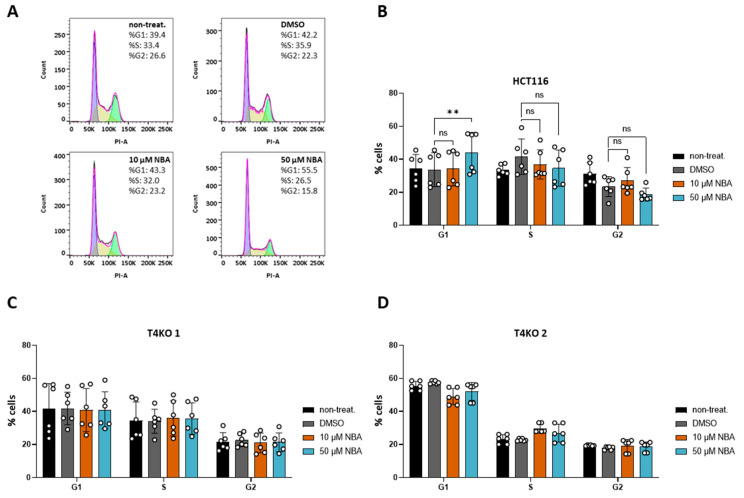
Figure 5.
Effect of NBA on cell cycle in HCT116 and T4KO cells. FACS-based cell cycle analysis. The experiment was repeated four times with from one to two replicates in each experiment. (A) Representative histograms of PI staining in HCT116 without inhibitor treatment, treated with DMSO and treated with 10 µM and 50 µM NBA, with cell distribution in % for one specific measurement. (B) Scatter plot and bar diagram (mean + SD) for cell cycle distribution of HCT116 without inhibitor treatment, treated with DMSO and treated with 10 µM and 50 µM NBA. (C) Scatter plot and bar diagram (mean + SD) for cell cycle distribution of T4KO 1 without inhibitor treatment, treated with DMSO and treated with 10 µM and 50 µM NBA. (D) Scatter plot and bar diagram (mean + SD) for cell cycle distribution of T4KO 2 without inhibitor treatment, treated with DMSO and treated with 10 µM and 50 µM NBA. One-way ANOVA was used to determine statistical significance (** p < 0.005, ns—non significant) in (B–D).

