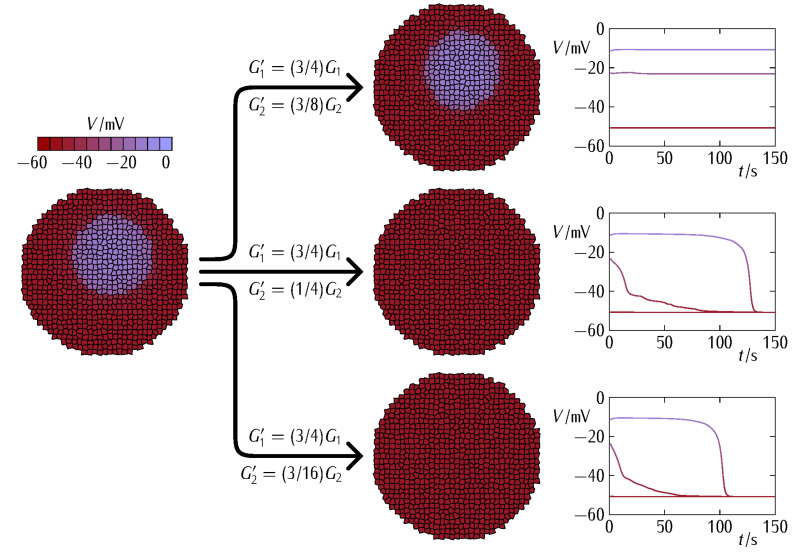
Figure 4.
The cell system changes due to a decrease in the conductances and to the new values (fixed decrease) and (three different decreases) shown in the figure (left). The community effect within the depolarized patch can still resist the polarization by the surrounding bulk region if the decrease is small (left, top). Thus, a minimum decrease of is needed to weaken the community effect within the patch enough to be polarized (left, intermediate). Further decreases in (left, bottom) only cause faster patch polarizations, as shown by the electrical potential changes in three cells located at the patch, the surrounding bulk, and the interfacial region (right). The single-cell maximum conductances assumed in Equations (1) and (2) are and , with . For the case of isolated cells, these conductances give the stable polarized and depolarized potentials and , respectively [39,47]. The ratio between the initially depolarized patch area and the whole system area is 0.16.

