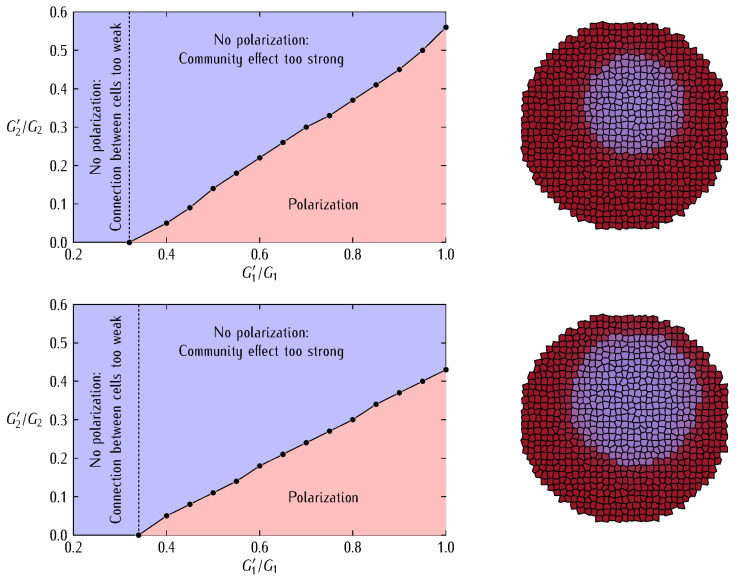
Figure 7.
The bioelectrical phase space showing the region where the polarization of the initially depolarized patch is possible (left). The x-coordinate corresponds to the ratio that parametrizes the assumed decrease in the minimum contribution to the intercellular connectivity. The y-coordinate corresponds to the ratio that parametrizes the assumed decrease in the maximum contribution of the intercellular connectivity. The initial bioelectrical state of the multicellular aggregate is also shown for two patch sizes (right). The patch bioelectrical normalization is not possible for those phase space regions where is too low because the weak intercellular connectivity does not allow the forced polarization to proceed in the multicellular aggregate. Additionally, patch normalization is not possible where is too high because the strong intercellular connectivity allows the community effect within the patch to resist polarization by the bulk. The single-cell parameters are those of Figure 4 and Figure 5. Note that the phase space regions may also depend on the particular heterotypic conductance at the interface between the patch and the surrounding bulk.

