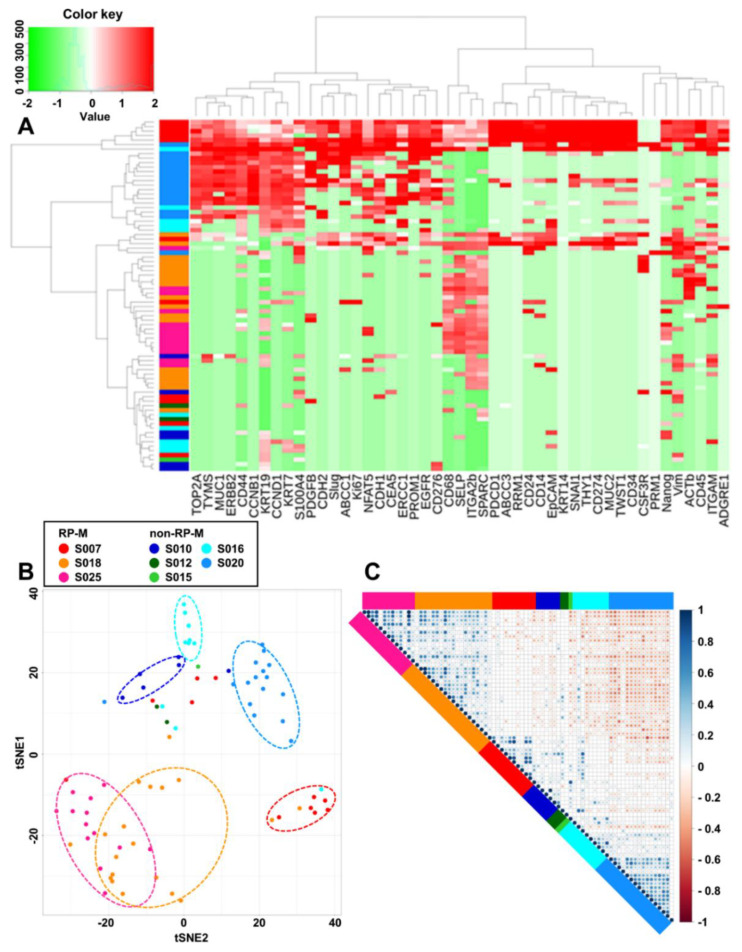
Figure 2.
Clustering of patient-derived CTCs according to the sample source. (A) Heat map for hierarchical clustering of the differentially expressed gene expression profiles of a single cell, color-coded, from eight different patients. (B) Two-dimensional t-SNE analysis based on hierarchical clustering of eight pancreatic cancer patients in two groups according to the progression (rapid progression in metastasis (RP-M): progression in metastasis for <60 days; non-rapid progression in metastasis (non-RP-M): progression in metastasis for >60 days). (C) Correlation matrix plot for eight pancreatic cancer patients. t-SNE, t-distributed stochastic neighbor embedding.

