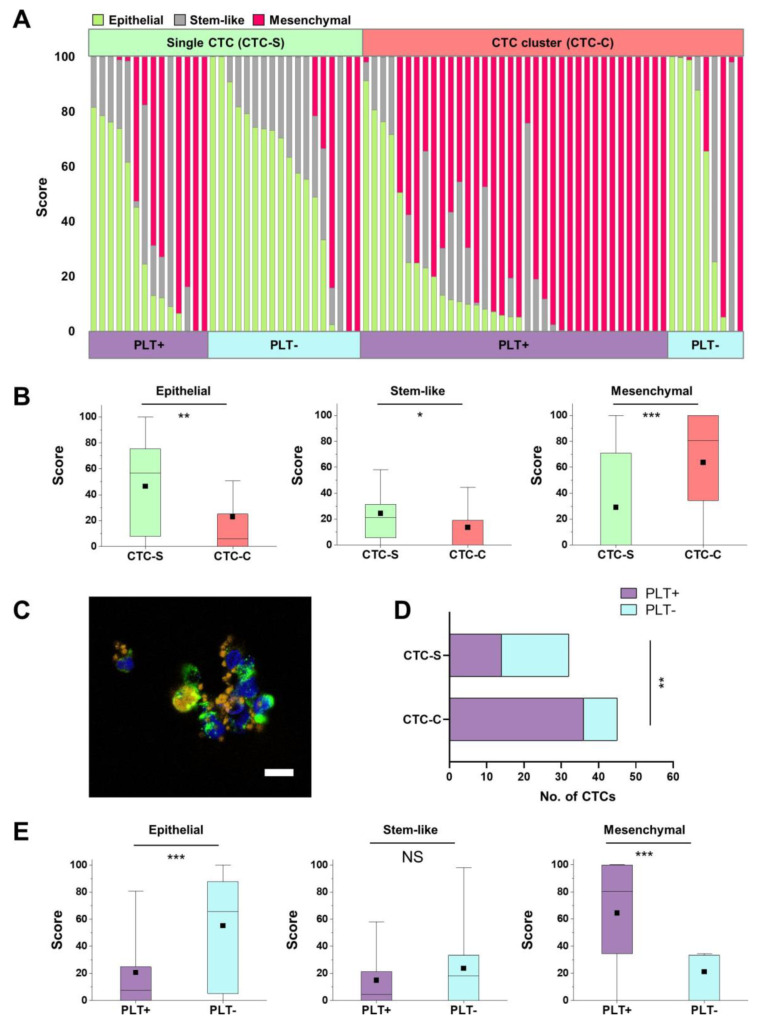
Figure 3.
Circulating tumor cell (CTC) characterization according to the subtypes. (A) CTCs classified into three categories (epithelial, stem-like, and mesenchymal CTCs) according to their subtypes: (1) CTC-S (single CTC) or CTC-C (CTC cluster) and (2) PLT+ group (platelet marker-positive group) or PLT− group (platelet marker-negative group). (B) The score of the three categories between CTC-S and CTC-C. Box plots show 25th and 75th percentiles, with lines indicating the median value and black square dots indicating the mean value. All the differences for the three categories between the two groups are statistically significant (* p < 0.05, ** p < 0.01, *** p < 0.001). (C) Fluorescence images of CTC-S (left) and CTC-C (right) with P-selectin-stained platelets at 60× (scale bar: 10 µm). (D) Fisher’s exact test based on the analysis of contingency tables between CTC-S and CTC-C according to the platelet marker expression (p = 0.0015). (E) The score for the three categories between the PLT+ group and the PLT− group. Box plots show 25th and 75th percentiles, with lines indicating the median value and black square dots indicating the mean value. The differences between the two groups for epithelial and mesenchymal scores are statistically significant (*** p < 0.001; NS: non-significant).

