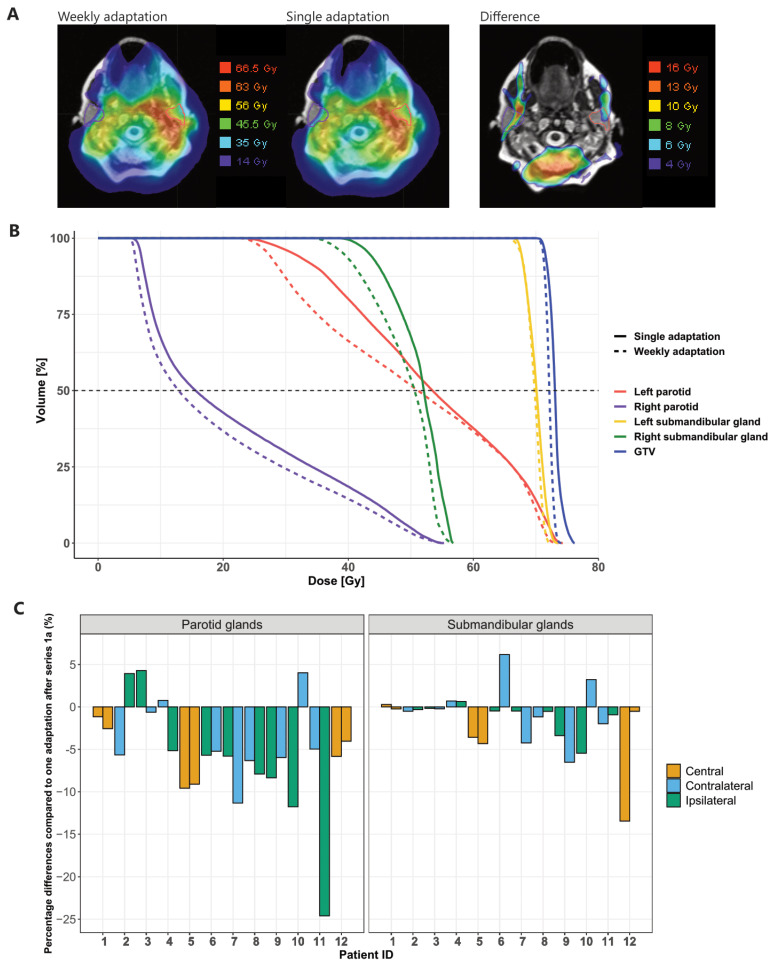
Figure 5.
The difference between weekly adaptation and one adaptation at the end of treatment. (A) Example of a dose distribution (patient 7) of weekly adaptation (left) or one single adaptation (middle) and the difference between dose distributions (right). (B) Corresponding DVHs of the patient in (A). (C) Dose difference for all the patients for the parotid glands (left) and the submandibular glands (right). Negative values mean that the cumulative planned dose was lower using weekly adaptation. In case of a symmetric bilateral treatment of a centrally located tumor without clear lateraliza-tion, the term “central” was used to indicate the location of the salivary glands.

