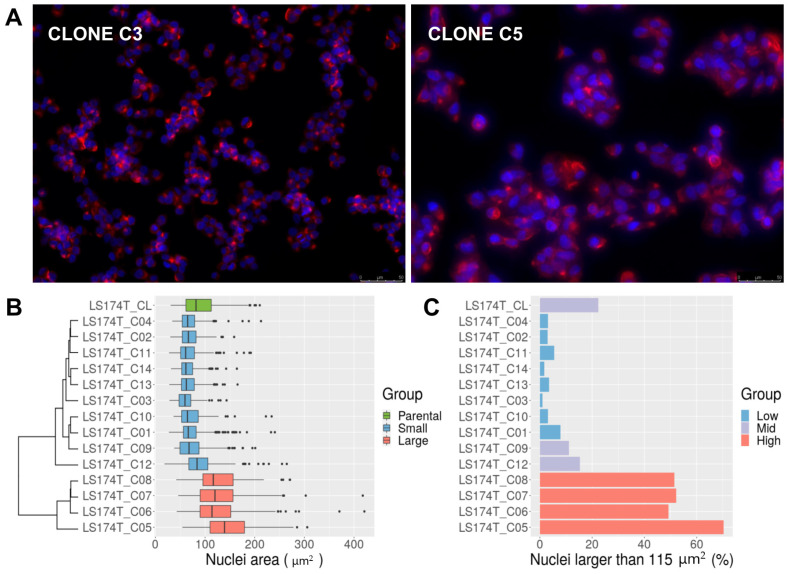
Figure 1.
(A) Morphological analysis of LS174T clones. The figure shows a small cell size clone (C3) and a large cell size clone (C5) stained with phalloidin (red, cytoskeleton) and DAPI (blue, nuclei). Pictures were taken at 200× magnification. Scale bar 50 μm is shown in the bottom right corner of the pictures. (B) Nuclei area of LS174T and derived clones, measured by microscopy after DAPI staining. The parental cell line (CL) in green. Clones are colored according to the average nuclei size into small (blue) and large (red) and classified by unsupervised clustering based on the difference of their average nuclei size (dendrogram on the left). (C) Percentage of nuclei with areas larger than 115 μm2 in LS174T and derived clones. Most of the clones exhibited a low proportion (less than 10%, low group, blue) of nuclei above 115 μm2. The parental cell line (CL) and clones C9 and C12 exhibited a larger proportion (10~25%, mid group, in purple). Clones C5–C8 exhibited around 50% of nuclei larger than that value (high group, in red).

