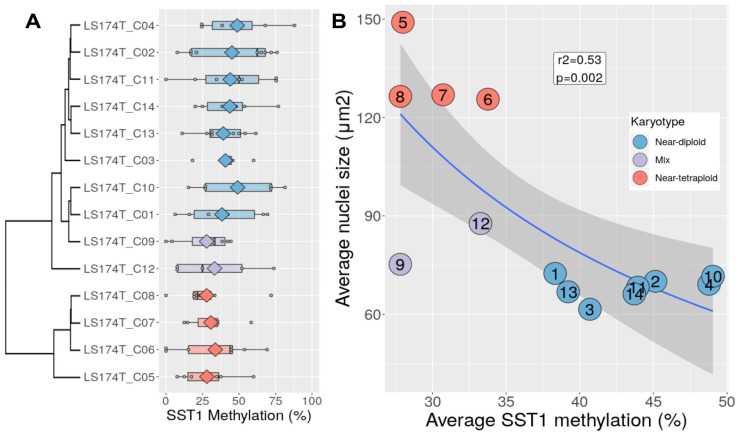
Figure 3.
(A) SST1 methylation levels measured by bisulfite sequencing in LS174T-derived single cell clones. Clones are ordered according to their nuclei size-based clustering (see Figure 1) and colored according to their karyotype. Every grey dot represents the average methylation of an individually sequenced SST1 molecule. Diamonds indicate the average methylation level of all SST1 the molecules sequenced in every clone. (B) SST1 average methylation (x-axis) vs. average nuclei size (y-axis) in LS174T-derived single-cell clones. Every dot represents the value of a LS174T-derived cell clone, colored according to its karyotype. The regression line (nuclei area ~ 1/methylation) and its 95% confidence interval are depicted in blue and dark grey, respectively. The inverse correlation between nuclei area and methylation was r = 0.73, r2 = 0.53, p = 0.002.

