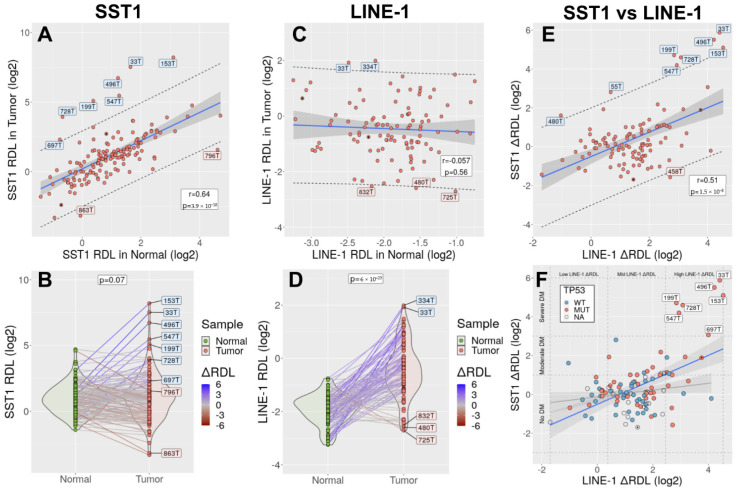
Figure 4.
(A) Correlation between SST1 RDL in 148 CRC tumors (y-axis) and matched normal tissues (x-axis). Every dot represents a tumor. In blue, the regression line. Shaded in grey, the 95% CI of the slope. The dashed lines indicate the 95% CI of the values predicted by the regression model. Labeled in blue and red, tumors with SST1 RDL above (strongly demethylated) and below the predicted upper limit of the 95% CI, respectively. Two metastases are indicated with an internal black dot. (B) SST1 RDL values in normal tissues (green) and tumors (red). Tumor and matched normal samples are connected by solid lines, colored according to their difference in SST1 RDL (somatic demethylation, ΔRDL). Tumors with SST1 RDL values outside the 95% CI of the regression model prediction (shown in panel A) are labeled. (C) Correlation between LINE-1 RDL in 107 tumors and matched normal tissues. Symbols as in panel A. (D) LINE-1 RDL values in normal tissues and tumors. Symbols as in panel B. (E) Correlation between SST1 ΔRDL and LINE-1 ΔRDL. Symbols as in panels A and C. (F) Correlation between LINE-1 and SST1 somatic demethylation in 107 CRCs. Tumors are colored according to their TP53 mutational status (WT: wild type; MUT: mutant; NA: not analyzed). The graph is divided with dashed lines in nine areas according to the levels of LINE-1 ∆RDL (horizontal axis, divided in low, mid and high demethylated) and SST1 ∆RDL (vertical axis, divided into no demethylated, moderately demethylated and strongly demethylated). Two regression models are depicted, one with all the samples (blue line) and the other excluding the SST1 strongly demethylated cases (grey line). The dark grey areas indicate the 95% CI of the slope.

