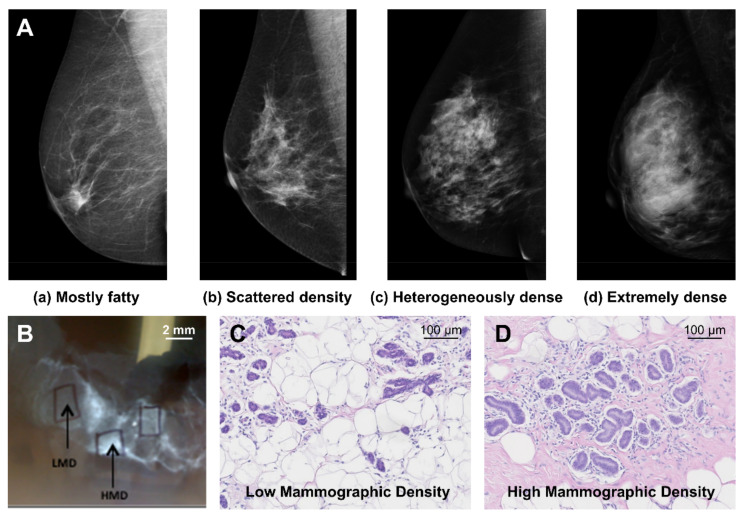
Figure 1.
(A) Example images of BIRADs classification of mammographic density, (B) X-ray of breast tissue demonstrates areas of low and high mammographic density associated with (C) more adipose tissue relative to fibro glandular tissue and (D) more fibro glandular tissue relative to adipose tissue respectively, when hemotoxylin and eosin stained. Images reproduced with permission from [14] Elsevier and www.informd.org.au (accessed 22 October 2021).

