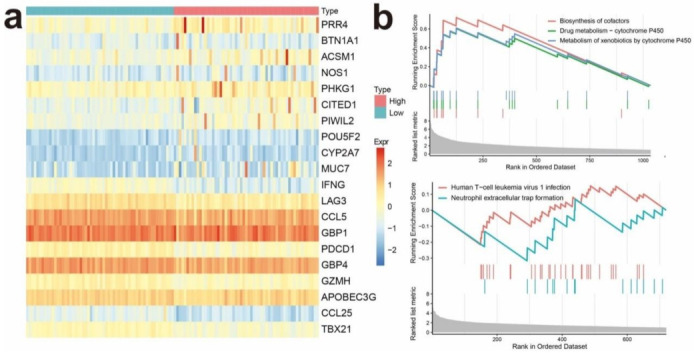
Figure 4.

Identifying differentially expressed genes (DEGs) in different IRGPI subgroups. (a) Heat map of DEGs between high and low IRGPI risk groups; (b) significantly enriched pathways of upregulated DEGs in the high (above) and low (below) IRGPI risk groups revealed by GSEA.
