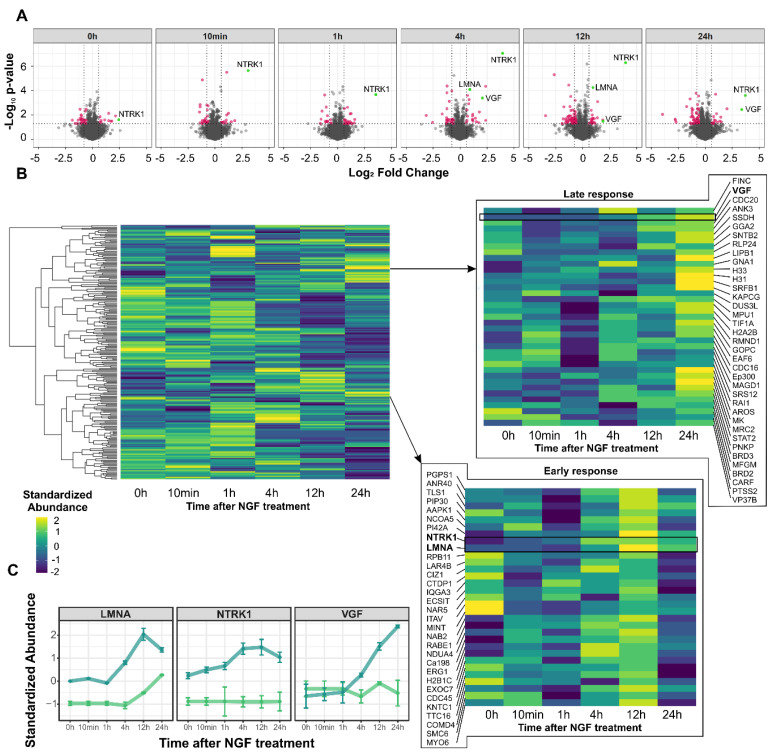
Figure 3.
Proteome dynamics induced by NGF−mediated NTRK1 activation in IMR5 cells. (A) Volcano plots illustrating the differential expression of proteins for the time points indicated. Significantly differentially abundant proteins highlighted in red (p-value ≤ 0.05; FC ≤ −1.5 or ≥ 1.5), selected proteins highlighted in green. (B) Heatmaps representing hierarchical cluster analysis (Pearson correlation, complete linkage) of significantly regulated proteins. Magnifications show clusters of proteins with late and early increasing abundance, respectively. (C) Regulation profiles of selected protein candidates in NGF-treated cells (blue) compared to untreated controls (green).

