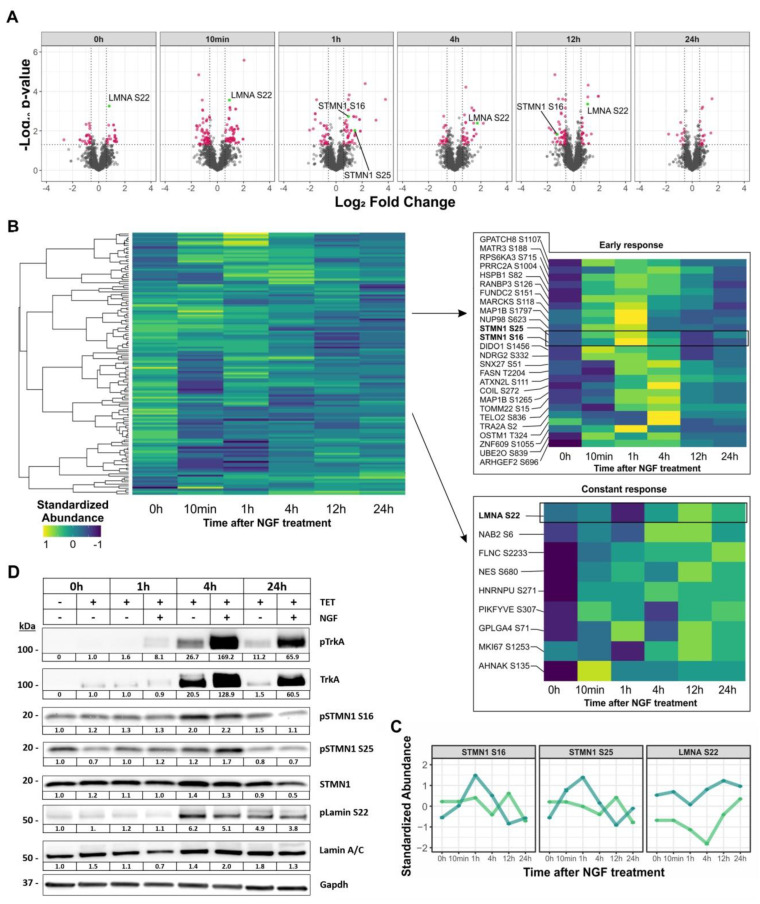
Figure 4.
Phosphorylation dynamics induced by NGF−mediated NTRK1 activation in IMR5 cells. (A) Volcano plots representing the results of differential phosphoproteome analysis for the time points indicated. Significantly regulated p-sites are highlighted in red (p-value ≤ 0.05; FC ≤ −1.5 or ≥ 1.5) and prominently regulated p-sites are highlighted in green. (B) Heatmaps representing hierarchical cluster analysis (Pearson correlation, complete linkage) of significantly regulated p-sites. Magnifications show clusters of p-sites with early and constantly increasing abundance, respectively. (C) Regulation profiles of selected p-sites in NGF-treated cells (blue) compared to untreated controls (green). (D) Orthogonal validation of selected phosphorylation target sites shown in (C) using Western blot analyses of independent experiments. Cells were either treated with TET or a combination of TET/NGF for time points indicated to induce and activate NTRK1/TrkA, respectively. Phosphorylated states of NTRK1/TrkA, STMN1 and Lamin A/C and their regulation in relation to total protein expression are shown. Gapdh served as a loading control. Numbers indicate fold expression changes over time normalized to t = 0 h for each individual protein analyzed. Uncropped blots were added in Supplementary Materials.

