Figure 6.
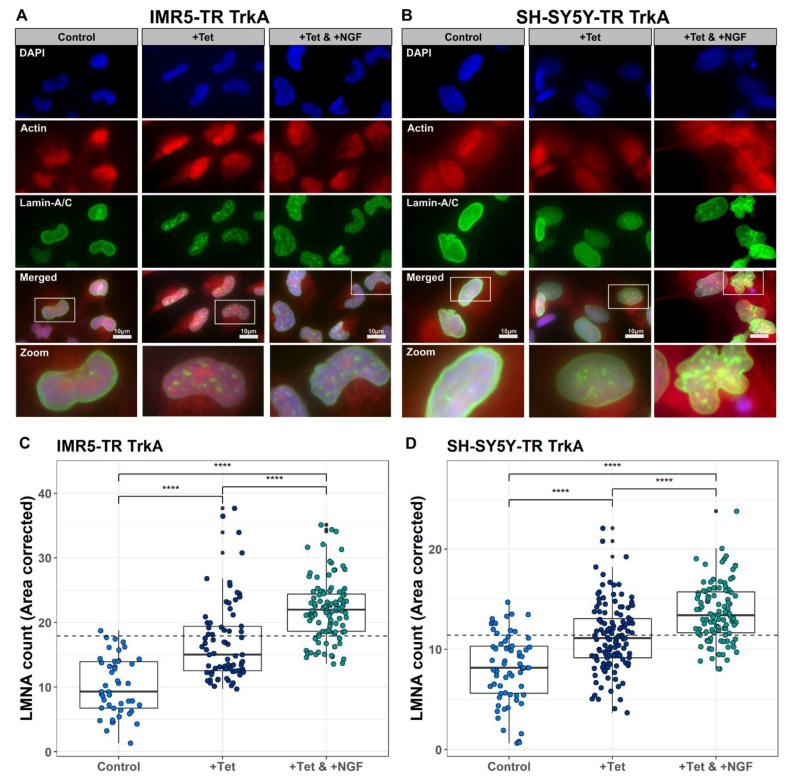
Changes in nuclear localization of LMNA upon NTRK1 expression and activation. Representative immunofluorescence stainings of LMNA (green) illustrating accumulation of LMNA within foci inside the nuclei upon NTRK1 expression and activation for IMR5 (A) and SH-SY5Y cells (B) (actin = red, DAPI = blue). In the merged pictures, zoom-ins are marked to highlight the foci formation in individual cells. (C,D) Area-corrected count of LMNA foci in IMR5 (C) and SH-SY5Y cells (D). Individual data points correspond to analyzed pictures. Significance (ANOVA with subsequent Tukey’s post hoc analysis **** p < 0.0005, p-values Bonferroni-corrected) is indicated by asterisks.

