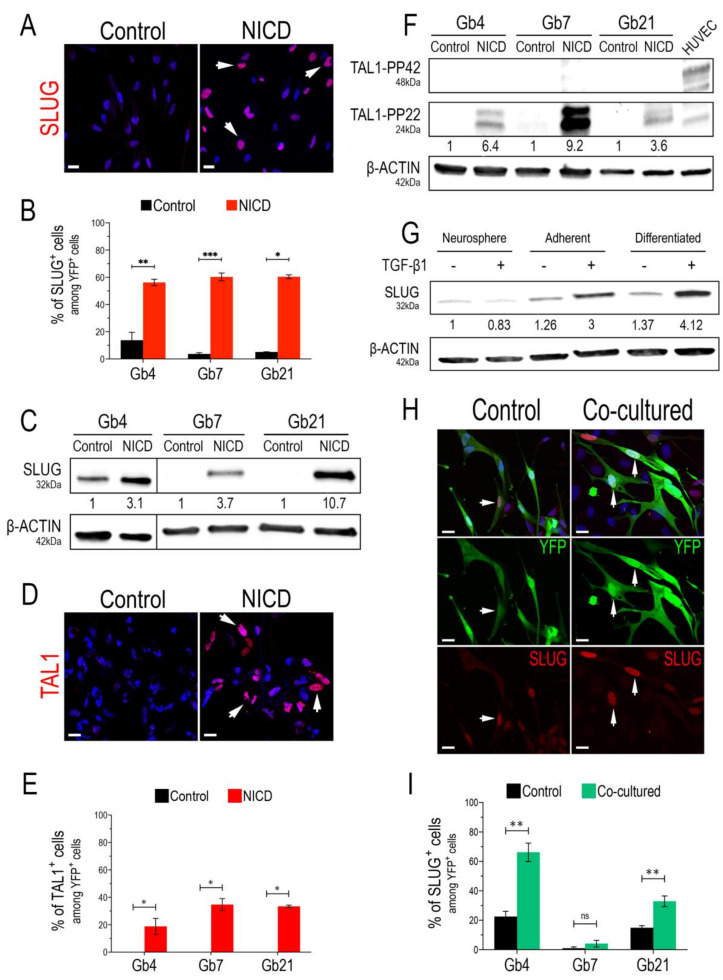
Figure 1.
SLUG and TAL1 expression in cultured GSCs. (A,D) Representative IF images showing SLUG upregulation in Gb4 (A) and TAL1 induction (D) in Gb7 upon the transduction of the Notch1 IntraCellular Domain (NICD) in proliferating adherent conditions (PDL/Laminin). Arrowheads indicate positive cells; scales 20 µm. (B,E) Quantification of SLUG+/TAL1+ cells following Notch1 activation in Gb4, Gb7, and Gb21 cells. (C,F) Representative WB images and quantifications showing SLUG upregulation (C) and TAL1-PP22 induction (F) in Gb4, Gb7, and Gb21 cells upon NICD transduction (n = 3, Figure S9A,B). (C) The original image was modified so that the Gb4 lanes appear on the left. (G) SLUG expression and upregulation in Gb4 cells using different culture methods; including proliferating neurospheres, adherent proliferating, and adherent differentiating conditions; with (+) or without (−) TGB-β1 treatment (2 ng/mL). Cells were harvested after 5 days of culture and/or treatment. Proliferating neurosphere conditions without TGB-β1 treatment were used as the basal condition for quantifications (n = 3, Figure S9C). (H) Representative IF images of SLUG upregulation in Gb4 cells upon co-culture with HUVEC endothelial cells. Cells were cocultured for 72 h and transduced with a YFP lentivirus in order to discriminate them from HUVEC cells. Arrowheads indicate YFP+ Gb4 GSCs. scales 20 µm. (I) Quantification of YFP+SLUG+ Gb4, Gb7, and Gb21 cells after co-culture with HUVEC cells (72 h). (B,E,I) Statistical analyses using rank Mann–Whitney tests, n = 3, ≥150 YFP+ cells quantified per experiment, ***, p < 0.001; **, p < 0.01; *, p ≤ 0.05, n.s. = not significant.

