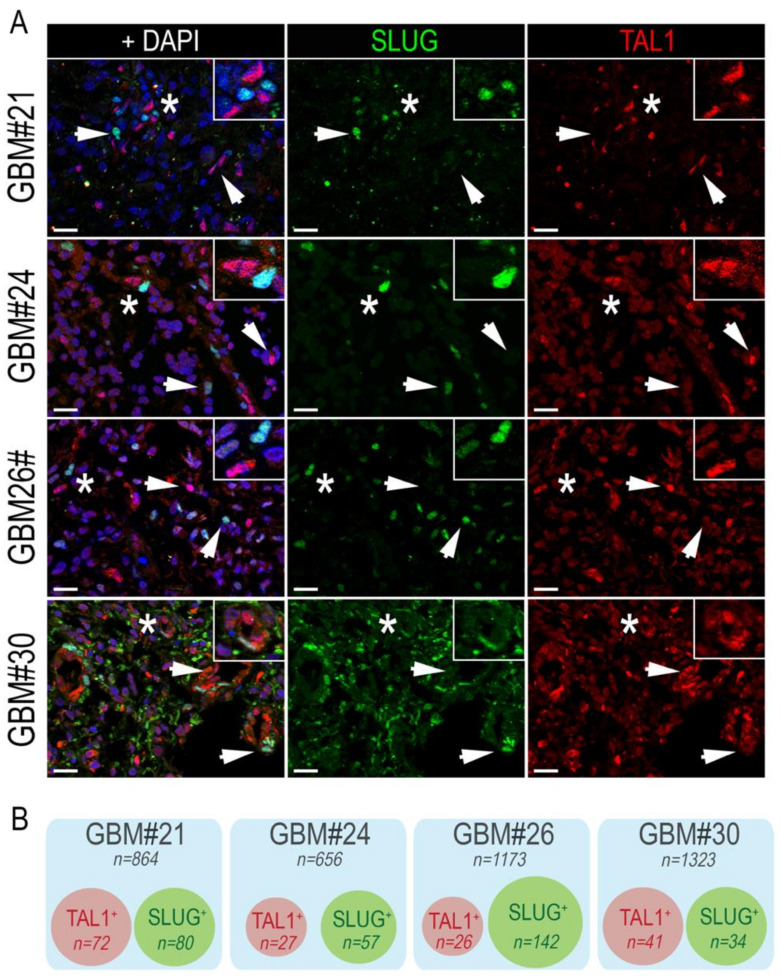
Figure 3.
SLUG+ and TAL1+ cells are mutually exclusive in GBM resections. (A) Representative IF images showing the mutually exclusive expression of SLUG and TAL1 in GBM#21, #24, #26, and #30 samples. Arrowheads point to either SLUG+ or TAL1+ cells. Stars indicate regions where SLUG+ and TAL1+ cells are in close vicinity and are magnified in upper right-hand corners of images; scales 20 µm. (B) Venn diagram representation of SLUG+ and TAL1+ distinct subpopulations in GBM#21, #24, #26, and #30. Squares represent entire samples, red circles represent TAL1+ cells, and green circles represent SLUG+ cells; n indicates the number of counted cells for each sample and subsets.

