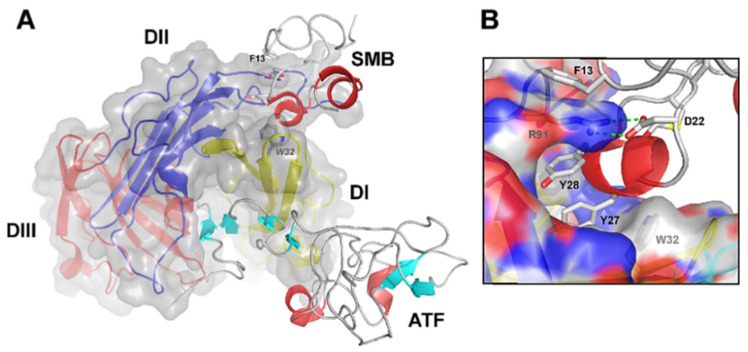
Figure 2.
Graphical representation of the crystal structure of the ternary uPA•uPAR•Vn complex. (A) A composite molecular model of the ATF•uPAR•SMB complex solved by X-ray crystallography is shown in (A) using the PDB coordinates 3BTI [37]. The structure is rotated 90° in the horizontal axis compared to Figure 1, providing a “top view” of uPAR and moving the cell surface to the back of the picture. As in Figure 1, uPAR is represented in a composite semitransparent surface and cartoon representation. The bound ligands ATF and SMB (representing uPA and Vn, respectively) are depicted as ribbons. A detailed view of the molecular binding interface between uPAR and SMB in this ternary complex is provided in (B). The corresponding hot spot residues in uPAR (R91 and W32) and SMB (F13, D22, Y27, and Y28) are highlighted and shown as sticks. Adapted from [23].

