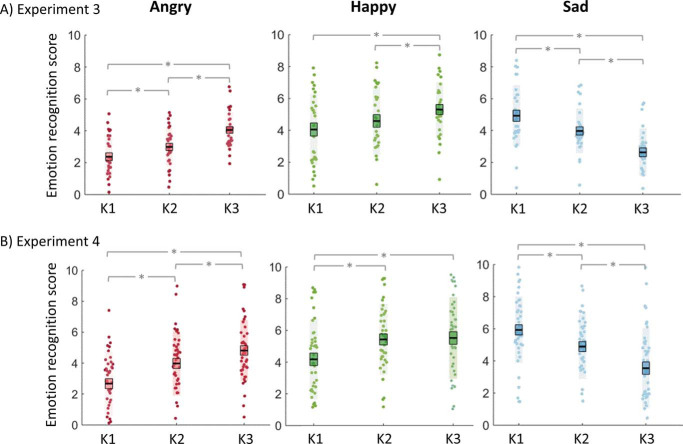
Figure 5. Plots of Emotion Recognition Task Results for Experiment 3 (A) and Experiment 4 (B) for Angry (Red), Happy (Green), and Sad (Blue) Facial Emotion Stimuli.
Note. Emotion recognition scores shown on the y-axis (emotion rating given to target emotion—mean emotion rating given to the two nontarget emotions) and scores are presented at each stimulus speed level from the slowest (K1) to the fastest (K3). The asterisk denotes significance at p < .05, following Bonferroni alpha correction applied to each comparison. For each condition, data points indicate individual participants. The thick black horizontal line represents the sample mean, the surrounding box represents 1 SEM and the shaded region represents 1 SD.

