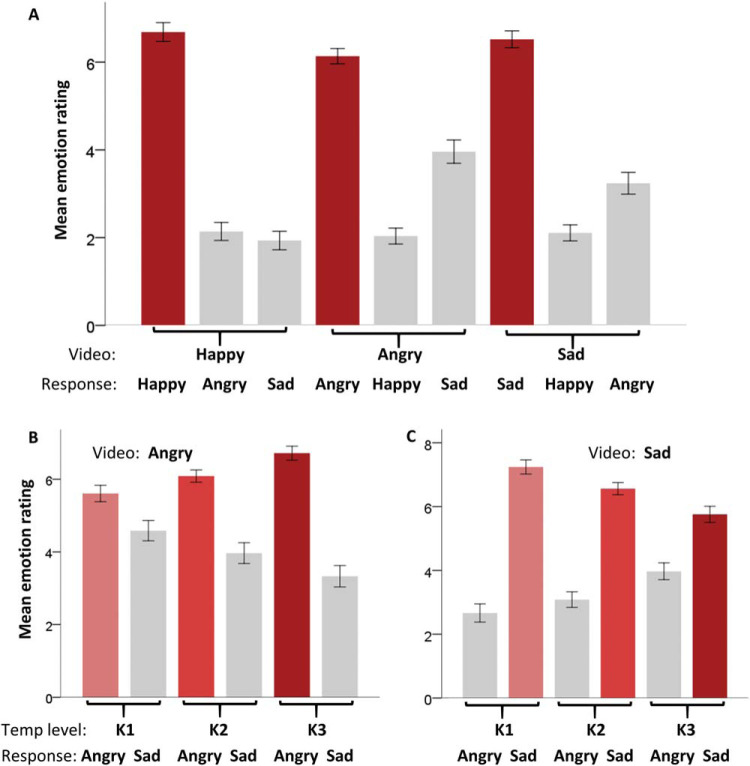
Figure 6. Plots From Experiment 3.
Note. (A) Mean emotion ratings for happy, angry, and sad for each of the target emotion videos happy, angry, and sad (B). Mean emotion ratings given on angry and sad scales for both the angry (left) and sad (right) videos, for speed levels K1, K2, and K3. Demonstrating as angry videos increase in speed, sad ratings decrease, while as sad videos increase in speed, angry ratings increase. Error bars represent 1 SEM.

