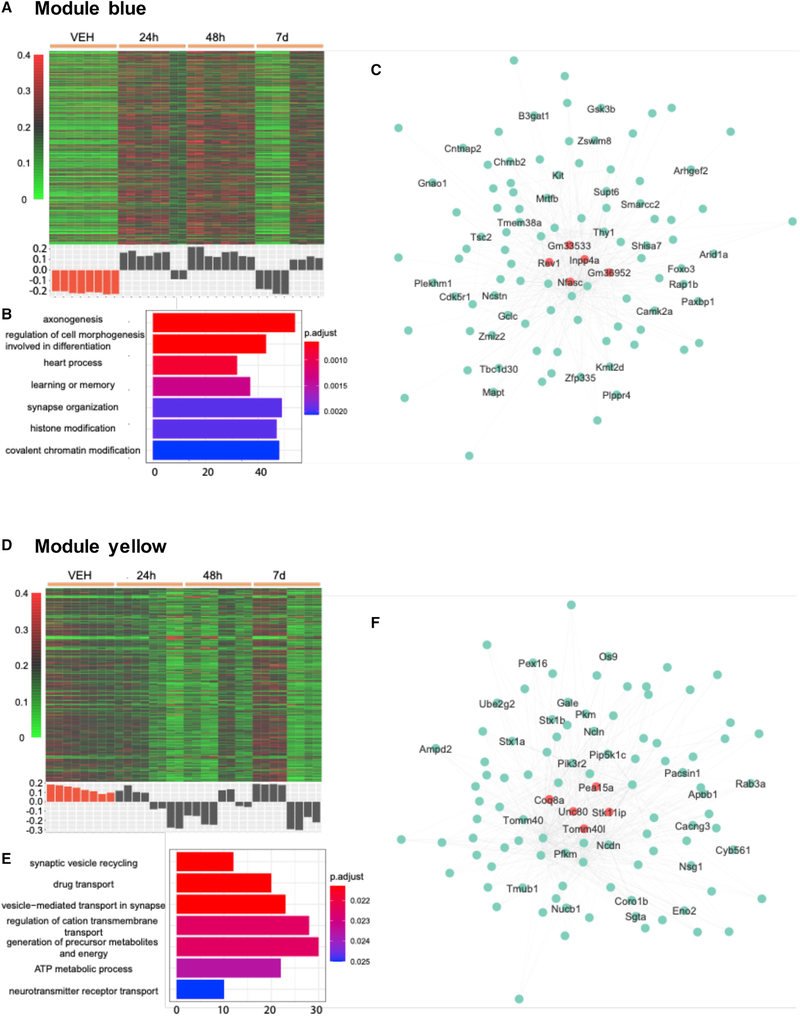
Figure 4. Two gene co-expression modules (blue and yellow) associated with administration of DOI.
(A and D) Heatmap of normalized gene expression profiles in the co-expression module (top). The module eigengene values across samples in four experimental groups (bottom).
(B and E) Selected top categories from GO enrichment analysis.
(C and F) Visualization of the intramodular connections among the top 100 hub genes in each module. The top 5 genes are in large size and colored orange. The genes involved in the top 15 GO terms are labeled.

