
Figure 2.
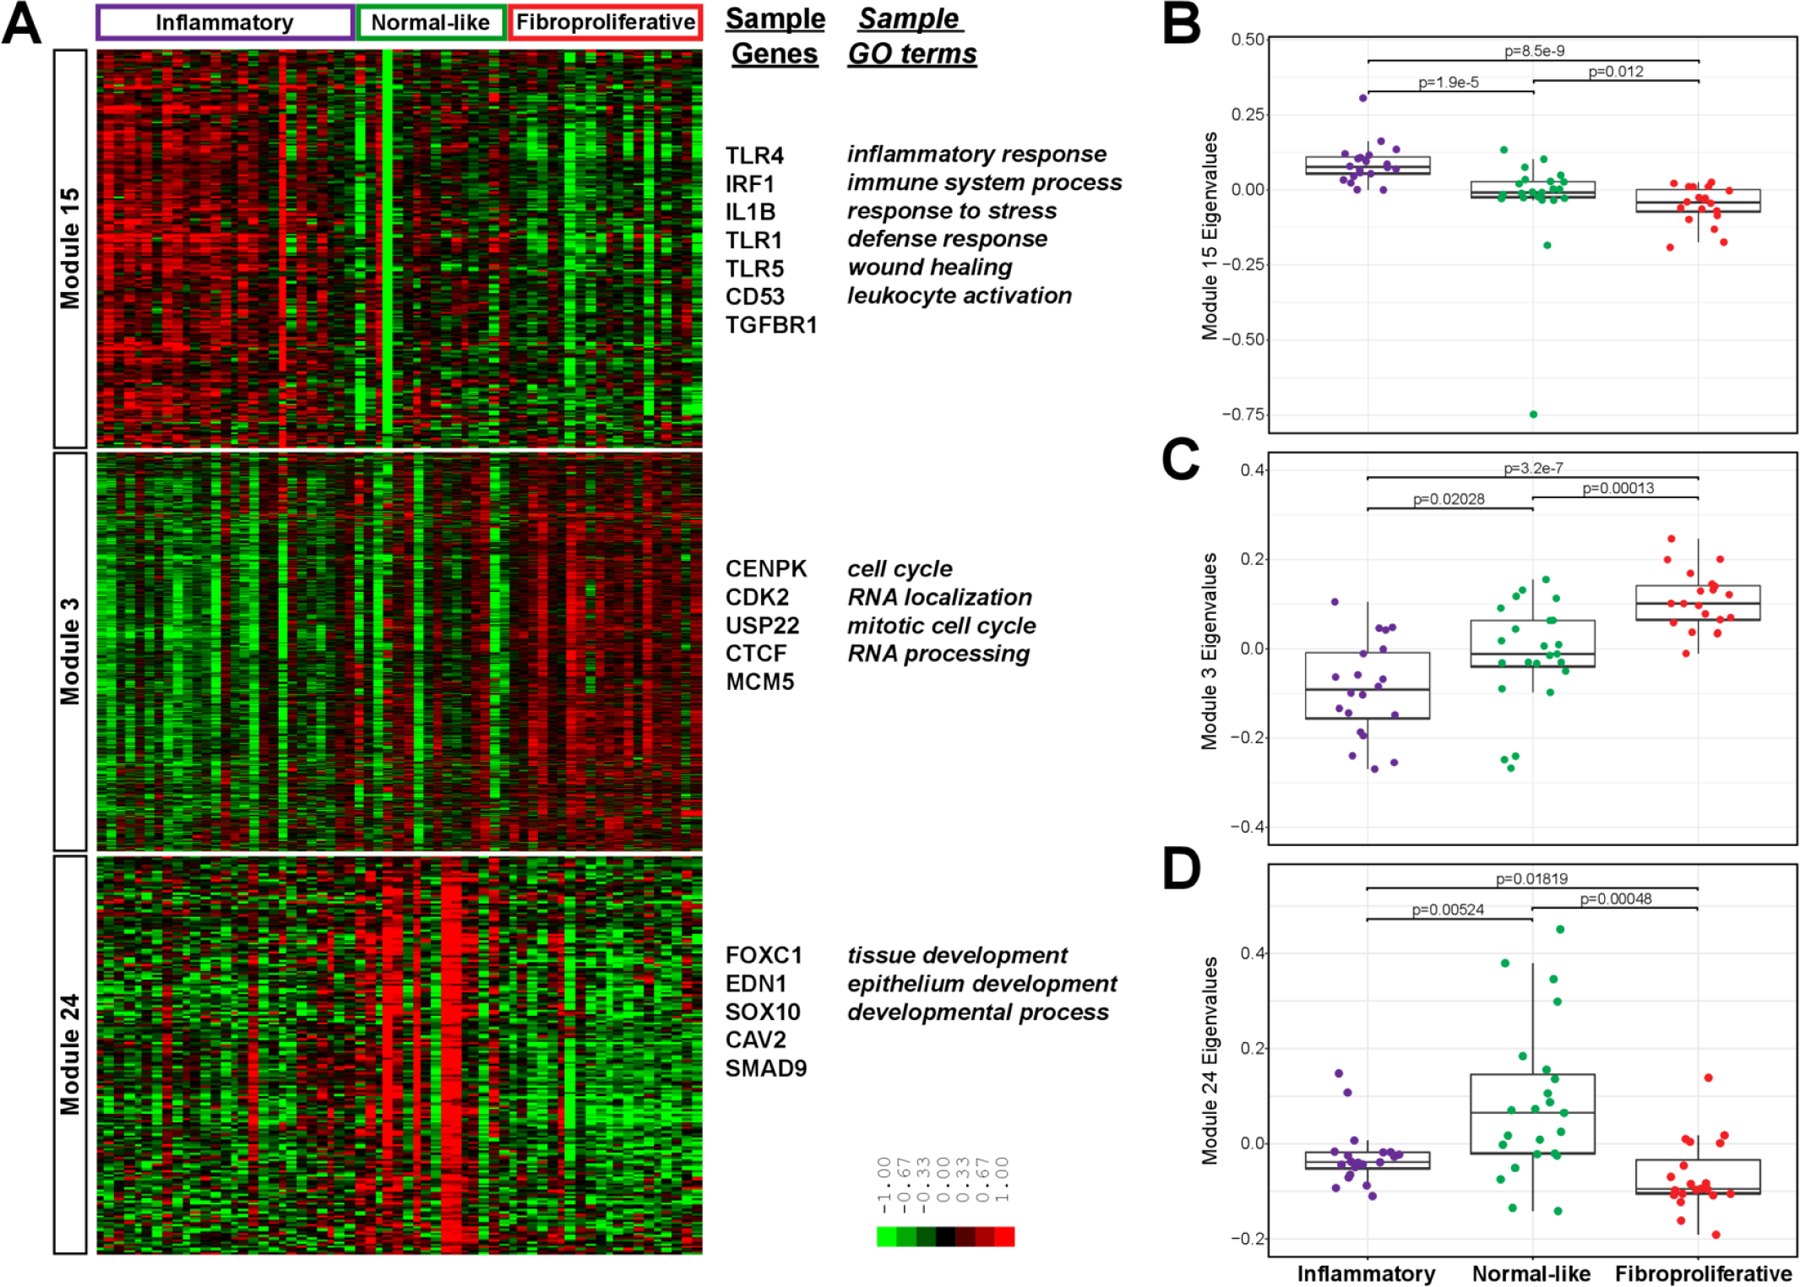
Intrinsic subsets in blood. (A) Gene expression values are displayed in a heatmap where each row is a gene in a WGCNA module and each column is a participant, ordered and labelled by intrinsic subset at the top. The eigenvalues for each sample, stratified by intrinsic subset, are plotted for the (B) inflammatory module, (C) fibroproliferative module and (D) normal-like module. P values are for Wilcoxon rank sum test. For B–D, n=20, 23 and 20 for inflammatory, normal-like and fibroproliferative intrinsic subsets. GO, gene ontology; WGCNA, weighted gene coexpression network analysis.