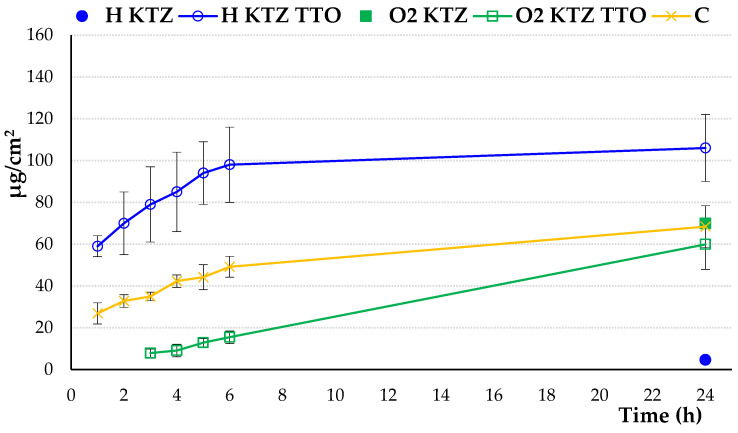
Figure 6.
In vitro permeation profile (expressed as the amount of drug permeated to acceptor phase per unit membrane area) of ketoconazole (KTZ) from hydrogel (H) and organogel (O2) formulations with pure drug or combination of drug and tea tree oil (TTO) as compared to control (commercial topical preparation with KTZ (C)). Values are expressed as means ± SD of six replicates; p ˂ 0.05.

