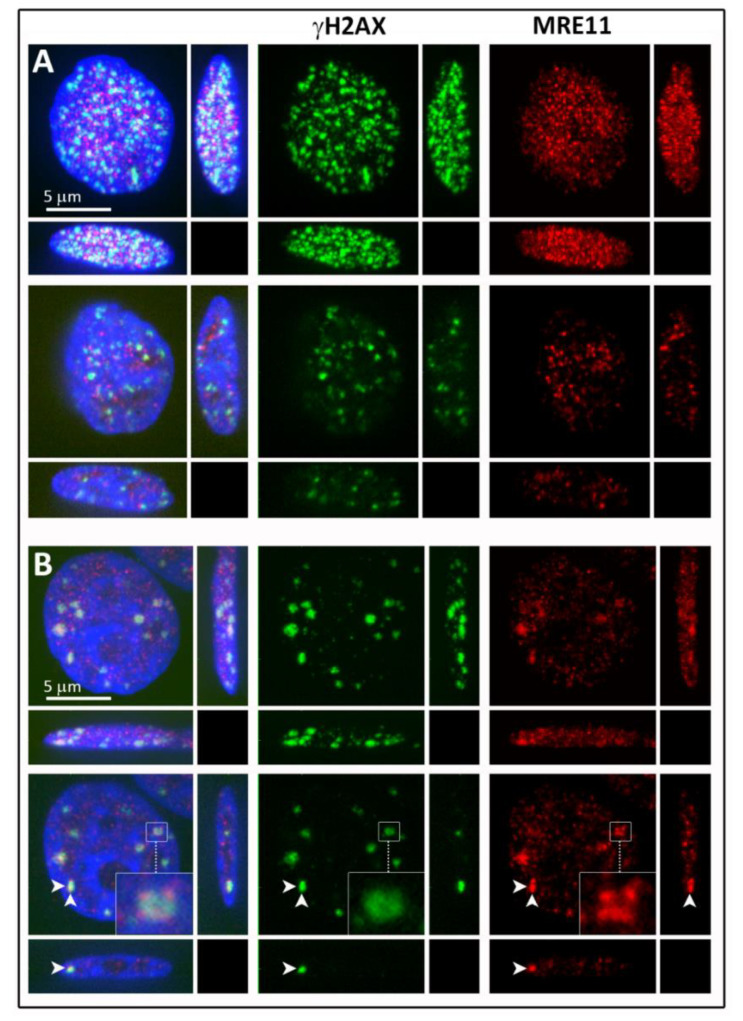
Figure 2.
Confocal images of γH2AX (green) and MRE11 (red) focus formation in breast cancer cells exposed to 2 Gy of γ-radiation and left repair DSBs for 30 min (A) or 4 h (B). The top line of both panels represents the maximum immunofluorescence confocal microscopy images composed of 40 optical confocal slices (0.2 µm thick) and shown in all three x-y, x-z, and y-z planes. The bottom lines show a single confocal slice through the nuclei displayed in the top lines. For the post-irradiation period of 4 h, the inserts show a selected γH2AX+MRE11 focus in a magnified view. The white arrows indicate the position of x-y and y-z confocal planes. Chromatin counterstaining was performed with DAPI (artificially blue).

