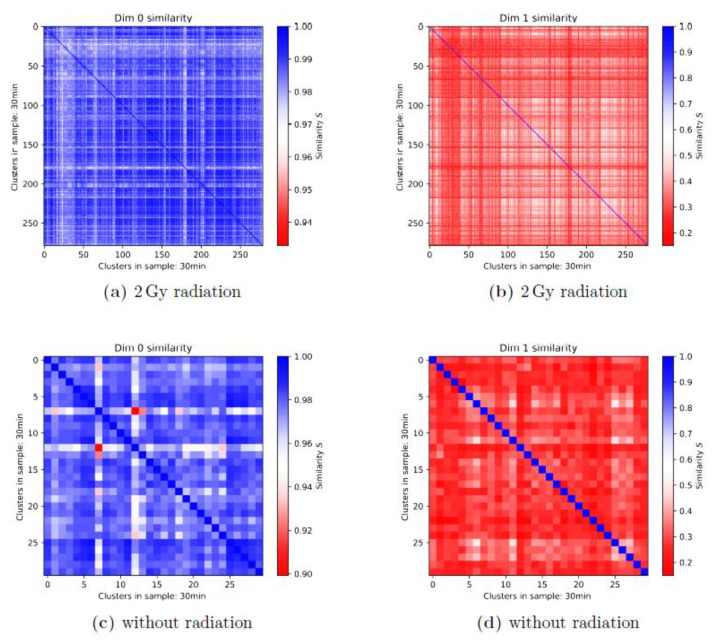
Figure 5.
First-generation heatmaps of γH2AX clusters in MCF-7 cells of (a,b) the irradiated samples (2 Gy) and (c,d) the non-irradiated control at the time point of 30 min after irradiation. (a,c) Heatmaps of the components; (b,d) heatmaps of the holes. Note the different color bars and the significantly different cluster numbers (more than 278 for the irradiated specimen vs. 30 for the non-irradiated specimen).

