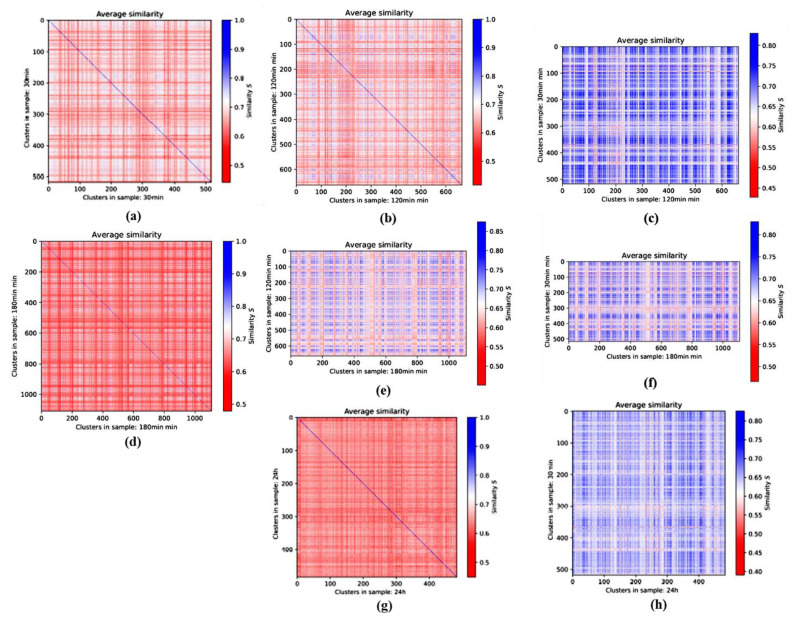
Figure 6.
Averaged 1st-generation heatmaps of γH2AX clusters of the skin fibroblast cell line CCD-1059SK. Pairwise comparison of clusters (a) 30 min, (b) 120 min, (d) 180 min, and (g) 24 h after irradiation. (c) Comparison of 30 min with 120 min clusters, (e) 120 min with 180 min clusters, (f) 30 min with 180 min clusters, and (h) 30 min with 24 h clusters. Note the differences in the color bars of the heatmaps comparing the same time point and comparing different time points.

