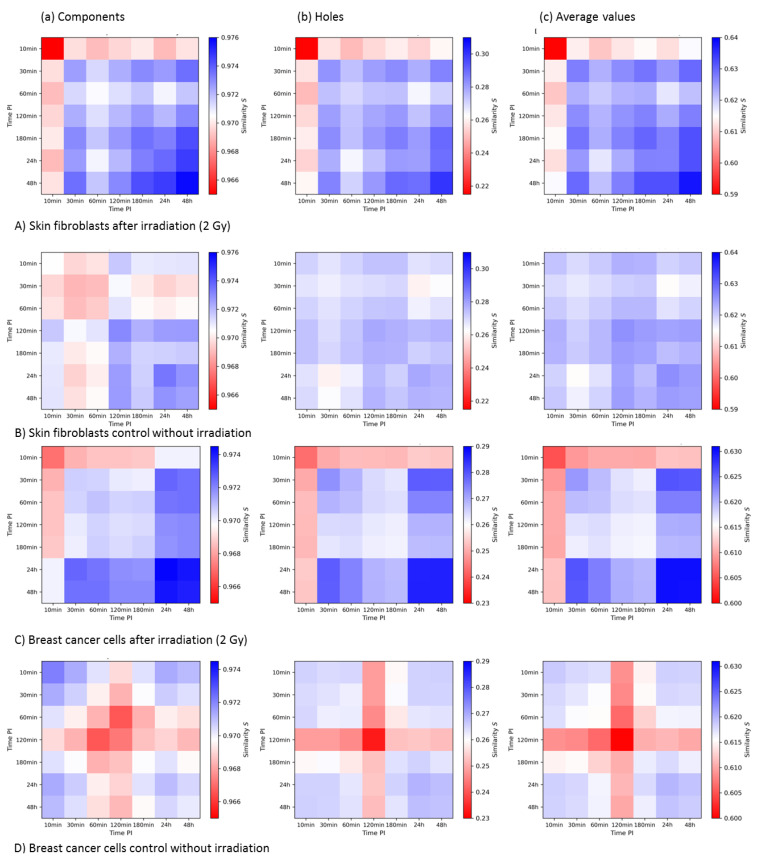
Figure 8.
Second-generation heatmaps of MRE11 clusters of components (a) and holes (b) and average values of both (c) for the skin fibroblast cell line CCD-1059SK (A,B) and the breast cancer cell line MCF-7 (C,D). Each value of a pixel of these heatmaps represents the mean value of one 1st-generation heatmap. Note the differences in the color bars between (a–c), while the visual pattern may be similar.

