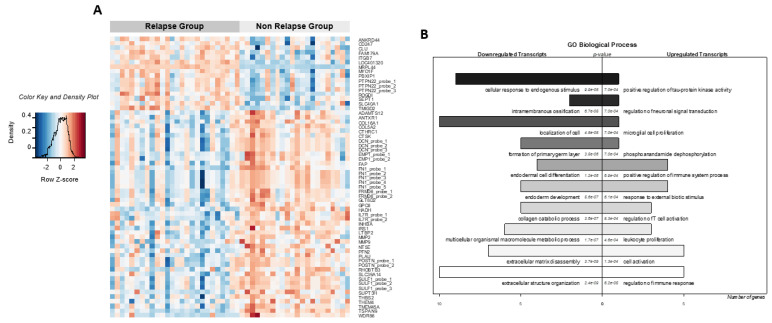
Figure 2.
Molecular signature associated with clinical outcome and Gene Ontology Biological Process enrichment. (A) Heatmap of microarray data showing the 47 deregulated genes in “relapsing” (n = 26, dark grey) compared to “non-relapsing” samples (n = 22, light grey). Each column represents a sample, and each row a probe set or gene. The expression level of each probe set was standardized by subtracting that probe set’s mean expression from its expression value and then dividing this by the standard deviation across all the samples. This scaled expression value, designated as the row Z-score, was plotted using a red–blue color scale with red indicating high expression and blue indicating low expression. (B) Enrichment of these deregulated genes within the Gene Ontology (GO) categories with the 10 most-listed GO biological processes categories (p < 0.01). The number of probe sets downregulated or upregulated in “relapsing” specimens is represented below. The p-values of each GO category are reported on the graph.

