Figure 3.
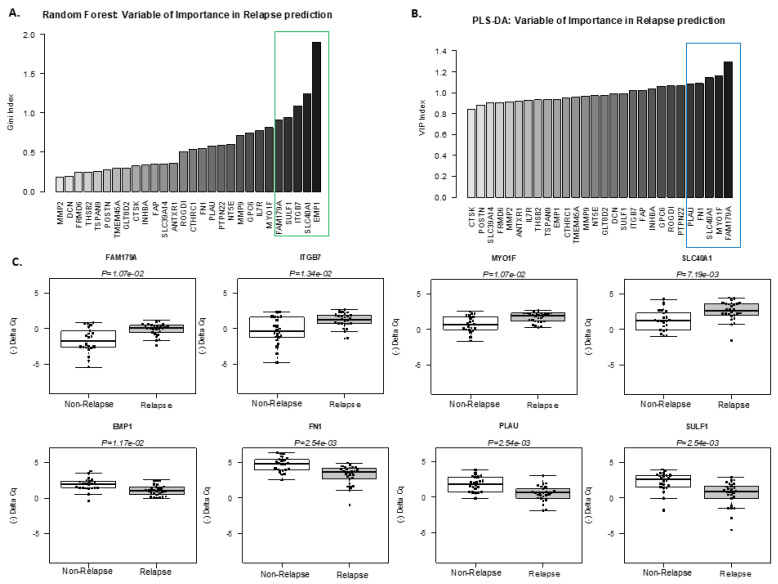
Selection of best predictive genes for outcome stratification by Random Forest and PLS-DA analysis of high-throughput RT-qPCR data. Relative importance of genes that discriminated between “relapsing” and “non-relapsing” groups in high-throughput RT-qPCR data. The bar plots show the mean Gini index of each gene from Random Forest classification (A) and variable importance in the projection (VIP) of the PLS-DA method with (B) larger values (to the right of the graph) indicating a more important gene within the model. The five top genes are highlighted by a grey box. (C) Box plots and strip-charts showing high-throughput qPCR quantification of the 8 selected genes in “relapsing” (grey, n = 26) and “non-relapsing” (white, n = 22) samples. Statistical significance was calculated using the Wilcoxon test followed by a Benjamini and Hoechberg correction. Expressions are given as (−∆Cq).

