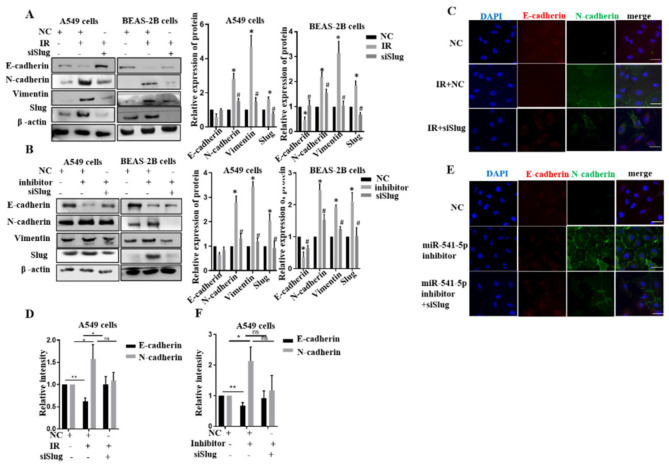
Figure 4.
The siSlug inhibited the EMT induced by IR combined with the knockdown of miR–541–5p. (A) Transfection of siSlug (100 nM) after irradiation of A549 and BEAS-2B cells using 6 Gy and detection of EMT-related protein expression after 48 h. The histogram shows the gray value analysis. (B) A549 and Beas 2B cells cotransfected with miR–541–5p inhibitor and siSlug. Left: the expression of the EMT–related proteins was examined 48 h after switching to the normal medium; Right: the quantitative analysis of the protein changes using ImageJ. (C) Immunofluorescence analysis examined the expression of the EMT–related proteins E-cadherin and N–cadherin through the transfection of siSlug after 6 Gy irradiation. Scale bar, 20 µm (D) The bar graph was generated by quantitatively analyzing the expression area and the relative fluorescence using ImageJ. * p < 0.05, ** p < 0.01 (E) Co–transfection of miR–541–5p and siSlug in A549 cells and immunofluorescence detection to determine the expressions of E–cadherin and N–cadherin in the cells. Scale bar, 20µm (F) The bar graph presents the quantified immunofluorescence results obtained using ImageJ. Data represents the mean ± SEM (n = 3), * p < 0.05 versus control of the same group; # p < 0.05 versus IR or inhibitor of the same group. ns: no significant.

