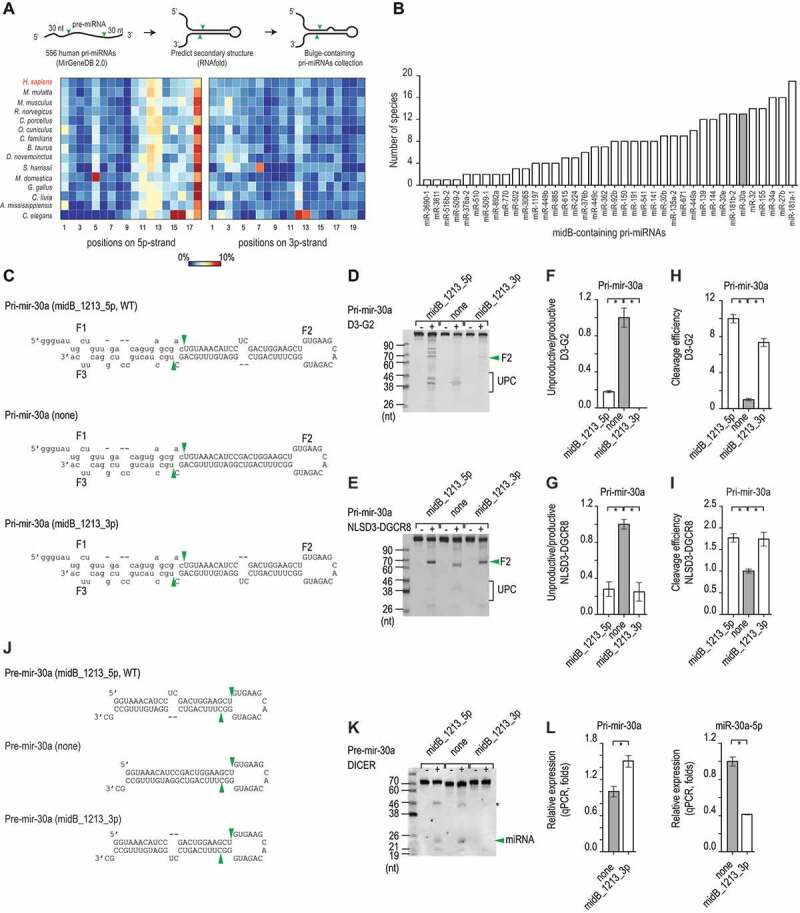
Figure 1.

The 5p-strand bulges block the unproductive cleavage. (A) The percentage of pri-miRNAs that contain bulges in different positions in humans and various other organisms was estimated. The numbers indicate the positions of the nucleotides in the upper stem from the Microprocessor cleavage site, and the colour bar indicates the percentage ranging from 0% (blue) to 10% (red). (B) The number of species that share each midB_containing pri-miRNAs. (C) The sequences and secondary structures of the three pri-mir-30a variants. The productive cleavage sites of Microprocessor are indicated by the green arrowheads. The pre-mir-30a sequence is shown as capital letters. (D and E) Gel images showing the in vitro processing of the pri-mir-30a variants by D3-G2 (D) or NLSD3-DGCR8 (E). A 4 pmol aliquot of each pri-mir-30a variant was incubated with 16 pmol D3-G2 or 8 pmol NLSD3-DGCR8 at 37°C for 120 min. UPC: unproductive cleavage products. (F − I) Bar charts to show the unproductive/productive ratios or cleavage efficiency (i.e. the productive/original substrate ratio) estimated from three repeated processing assays. The ratios for each midB variant were normalized to that of the ‘none’ variant. The data are presented as mean +/− SEM values and the asterisks (*) indicate statistically significant results (p < 0.05) when compared with the two-sided t-test. The unproductive/productive ratios obtained for D3-G2 cleavage of pri-mir-30a, indicated that midB_1213_5p versus none: p = 0.002, and midB_1213_3p versus none: p = 0.001. The cleavage efficiency of this assay showed that midB_1213_5p versus none: p = 5.6e-5, and midB_1213_3p versus none: p = 1.6e-4. The unproductive/productive ratios obtained for NLSD3-DGCR8 cleavage of pri-mir-30a indicated that midB_1213_5p versus none: p = 0.002, and midB_1213_3p versus none: p = 0.003. The cleavage efficiency of this assay showed that midB_1213_5p versus none : p = 0.002, and midB_1213_3p versus none: p = 0.01. (J) The sequences and secondary structures of the pre-mir-30a variants. The DICER cleavage sites are indicated by the green arrowheads. (K) A representative gel image to show the in vitro cleavage of the pre-mir-30a variants by DICER. A 5 pmol aliquot of pre-mir-30a was incubated with 1.75 pmol DICER at 37°C for 120 min. The green arrowhead indicates the miRNA, and the asterisk (*) indicates the unidentified RNA fragments. (L) The relative level of pri-mir-30a (left) and miR-30a (right) expression in HCT116 cells transfected with the pri-mir-30a pcDNA3.0 plasmids followed by qPCR. The expression levels of pri-mir-30a and miR-30a were normalized to those of pri-mir-1226 and miR-1226, respectively. These normalized expression levels were then normalized again to the level of expression of pri-mir-30a or miR-30a (indicated by ‘none’ on both graphs). The data are presented as the mean +/− SEM, and the asterisks (*) indicate statistically significant (p < 0.05) results when compared with the two-sided t-test. For pri-mir-30a, midB_1213_3p versus none: p = 0.046, and for miR-30a, midB_1213_3p versus none: p = 0.007
