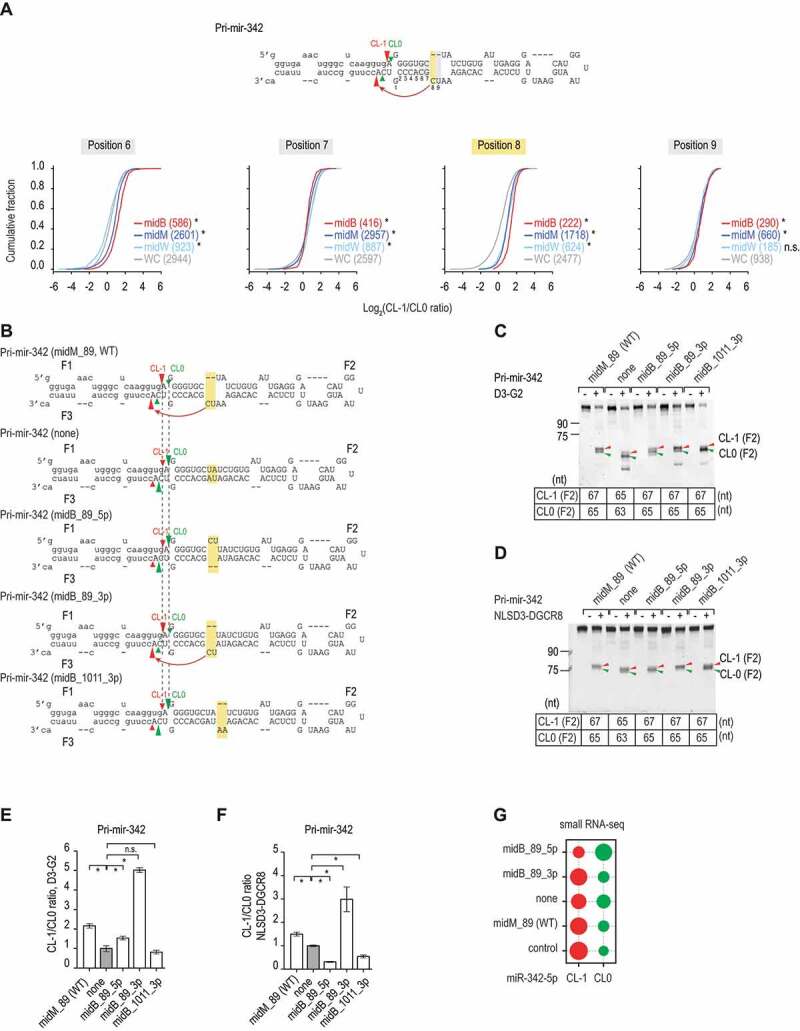
Figure 2.

The 3p-strand bulges affect the cleavage sites. (A) The ratios of the CL-1/CL0 cleavage were estimated for the pri-mir-342 variants, which contained bulges (midB), mismatches (midM), wobble base pairs (midW), or Watson-Cricks base pairs (WC) on the 3p-strand in positions 6–9 from the 5p-strand cleavage site. The pri-mir-342 variants were generated and cleaved by DROSHA, as described in our previous study [19] and Fig. S2A and S2B. The red, dark blue, light blue, and grey curves indicate the midB, midM, midW, and WC variants, respectively. The p-values were calculated by a two-sided Wilcoxon rank-sum test, for position 8, midM versus WC: p = 5.3e-117, midW versus WC: p = 1.8e-56, midB versus WC: p = 1.1e-57. (B) Diagrams showing the RNA sequences and secondary structures of the pri-mir-342 variants. The CL-1 and CL0 cleavage sites of Microprocessor are indicated by the red and green arrowheads, respectively. The mutated regions are highlighted in yellow. The pre-mir-342 sequence is shown in capital letters. (C and D) Gel images showing the size of bands after the pri-mir-342 variants were processed by D3-G2 or NLSD3-DGCR8. A 5 pmol aliquot of each pri-mir-342 variant was incubated with 10 pmol D3-G2 (C) or 6 pmol NLSD3-DGCR8 (D) at 37°C for 120 min. The sizes of the F2 bands resulting from the CL-1 and CL0 cleavages for each variant are shown in the tables below the gel images. (E and F) Bar charts showing the mean +/− SEM CL-1/CL0 ratios from the three repeated cleavage assays shown in C and D, respectively, for each pri-mir-342 variant. The band densities of each F2 fragment were quantified by Image Lab v.6.0.1. The CL-1/CL0 ratio of each variant was normalized to that of pri-mir-342 (none). The asterisk (*) and (n.s.) indicate statistically significant (p < 0.05) and no significant differences, respectively, when data were compared with the two-sided t-test. For the D3-G2 cleavage (E), midM_89 versus none: p = 0.003, midB_89_5p versus none: p = 0.039, midB_89_3p versus none: p = 3.2e-5, and midB_1011_3p versus none: p = 0.356. For the NLSD3-DGCR8 cleavage, midM_89 versus none: p = 0.006, midB_89_5p versus none: p = 1.0e-4, midB_89_3p versus none: p = 0.020, and midB_1011_3p versus none: p = 0.004. (G) The relative abundance of CL-1 or CL0 miR-342 in HCT116 cells transfected with pcDNA3.0 plasmids expressing each of the pri-mir-342 variants. HCT116 cells transfected with the pcDNA3.0 alone were used as a control. The relative abundance of each miRNA is indicated by the size of the circle
