
Figure 9.
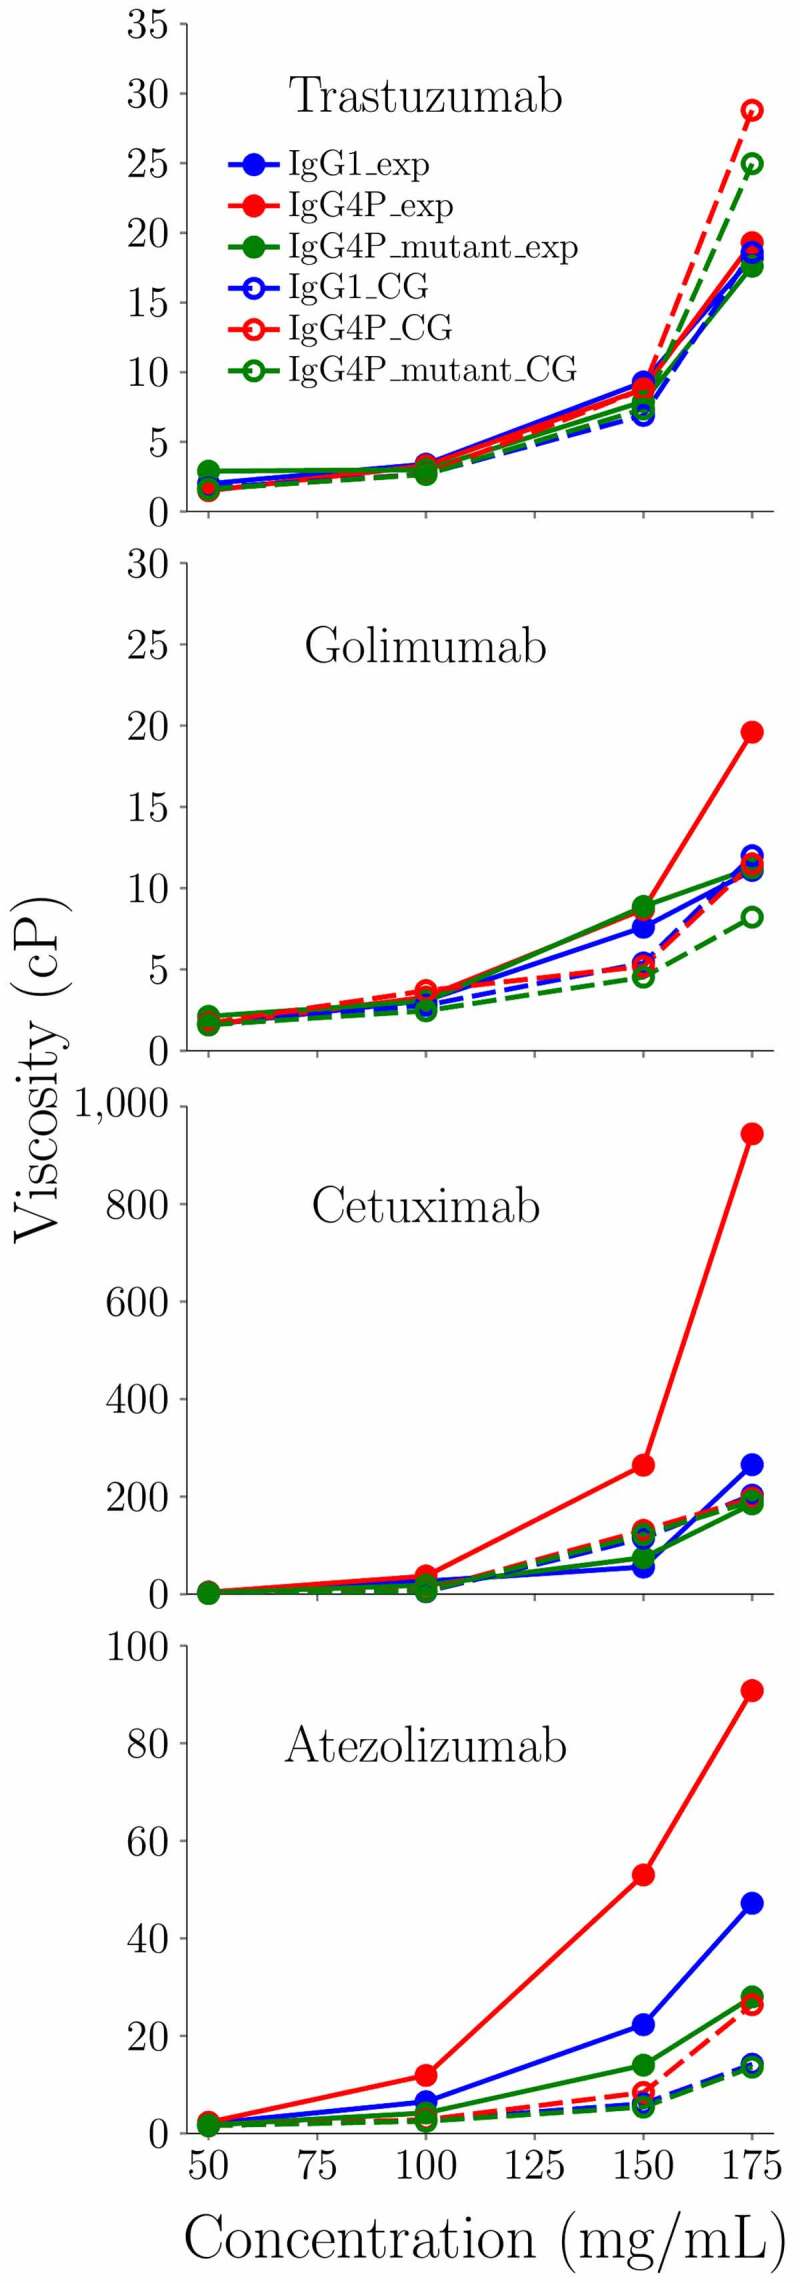
Concentration dependence of the zero-shear viscosity from CG models with the experimental viscosity data for IgG1 and IgG4P mAbs. Blue circles indicate experimental measurement of IgG1. Red squares indicate experimental measurement of IgG4P. Green triangles indicate experimental measurement of IgG4P CH3 swapped mutants. Blue lines indicate CG results of IgG1. Red dashed lines indicate CG results of IgG4P with kcal/mol and chgCH3 = −0.8 e. Green dotted dashed lines indicate CG results of IgG4P CH3 swapped mutants