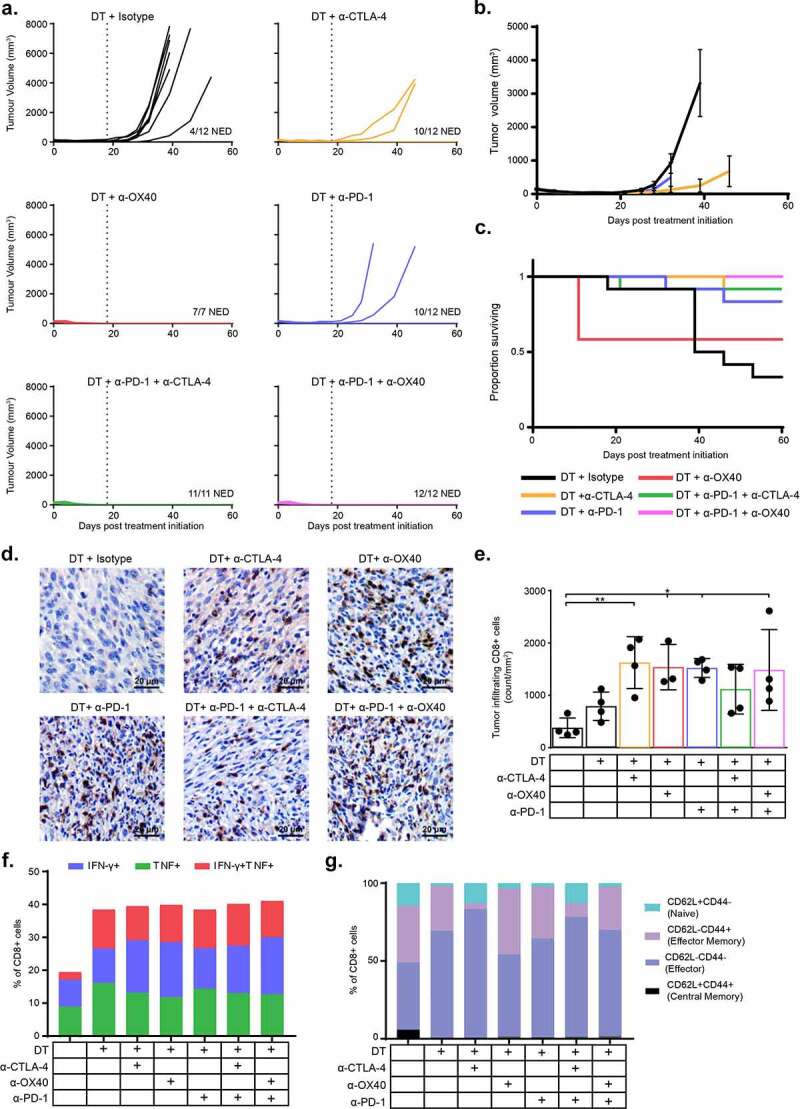
Figure 3.

DT treatment dramatically improves the efficacy of immunotherapies when dosed concurrently. C57BL/6 mice with BP tumors were treated for 19 Days with DT in addition to 6 doses of anti-CTLA-4, anti-OX40, anti-PD-1 or combinations including anti-PD-1 and either anti-CTLA-4 or anti-OX40. a. Individual tumor growth curves from start of therapy (D0) to D60 for each treatment group. b. Mean tumor growth curves for each treatment group until the first death in each group. c. Kaplan-Meier survival analysis of each treatment group until D60 post initiation of therapy. d. Representative CD8 IHC images from each treatment group at D4 on therapy (after 2 doses of antibodies). e. CD8 IHC summary data at D4. f. Summary flow cytometry analysis of tumor infiltrating CD8 T cell cytokine expression. g. Summary flow cytometry analysis of tumor infiltrating CD8 T cell memory subsets. * = p < .05, ** = p < .005
