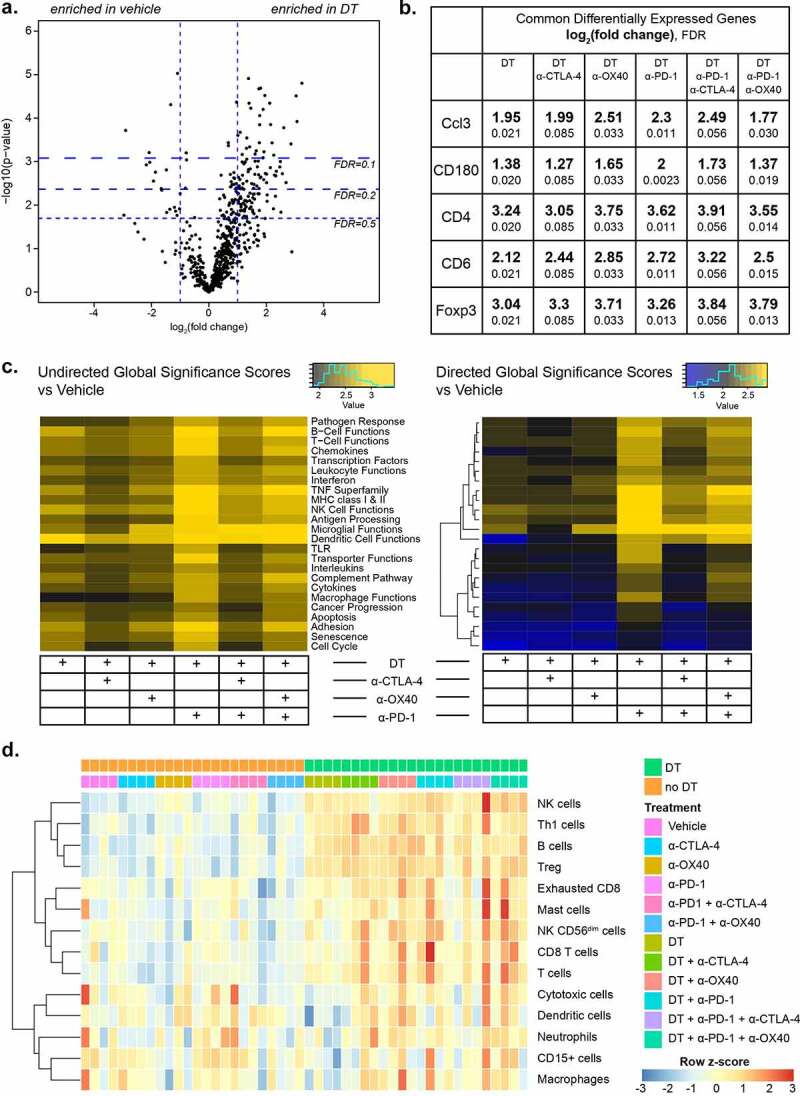
Figure 4.

DT transforms the tumor-immune microenvironment to a more favorable, inflamed phenotype. a. Volcano plot of differentially expressed genes measured by NanoString in DT vs vehicle treated tumors. b. Commonly differentially expressed genes shared by all treatment groups that incorporate DT vs vehicle treated tumors. c. NanoString undirected global significance scores (left) from each treatment group representing variation in gene expression across gene sets vs isotype treated tumors, and directed NanoString global significance scores (right) representing a net positive or negative direction to the overall variation in gene expression in a geneset. d. CIBERSORT analysis of Affymetrix data from all treatment groups, showing the prevalence of gene signatures from a large set of immune cell types
