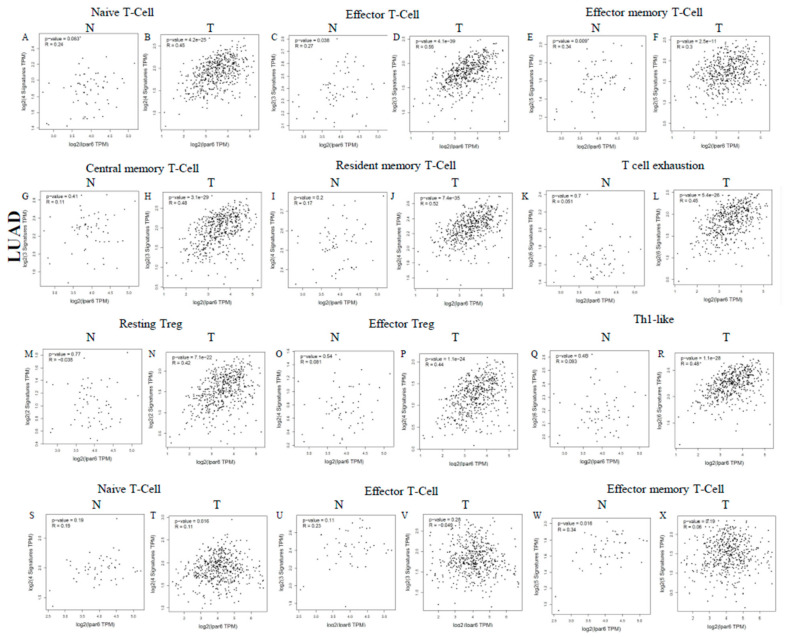
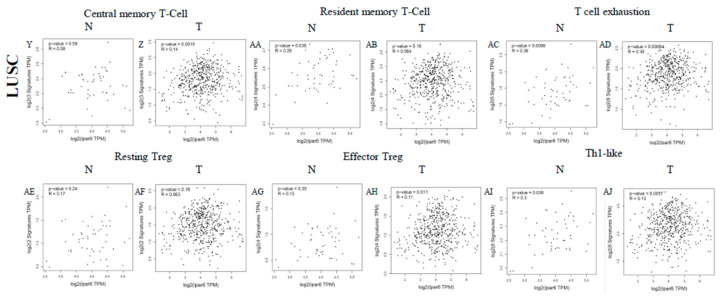
Figure 8.
Correlation analysis between LPAR6 expression and various immune cells in normal and tumor tissue of LUAD and LUSC. (A–R) Scatterplots of correlations between LPAR6 expression and naive T-cell (A,B), effector T-cell (C,D), effector memory T-cell (E,F), central memory T-cell (G,H), resident memory T-cell (I,J), T cell exhaustion (K,L), resting Treg (M,N), effector Treg (O,P), Th1-like (Q,R) in the normal and tissue of LUAD; (S–AJ) Scatterplots of correlations between LPAR6 expression and gene markers of naive T-cell (S,T), effector T-cell (U,V), effector memory T-cell (W,X), central memory T-cell (Y,Z), resident memory T-cell (AA,AB), T cell exhaustion (AC,AD), resting Treg (AE,AF), effector Treg (AG,AH), Th1-like (AI,AJ) in LUSC.


