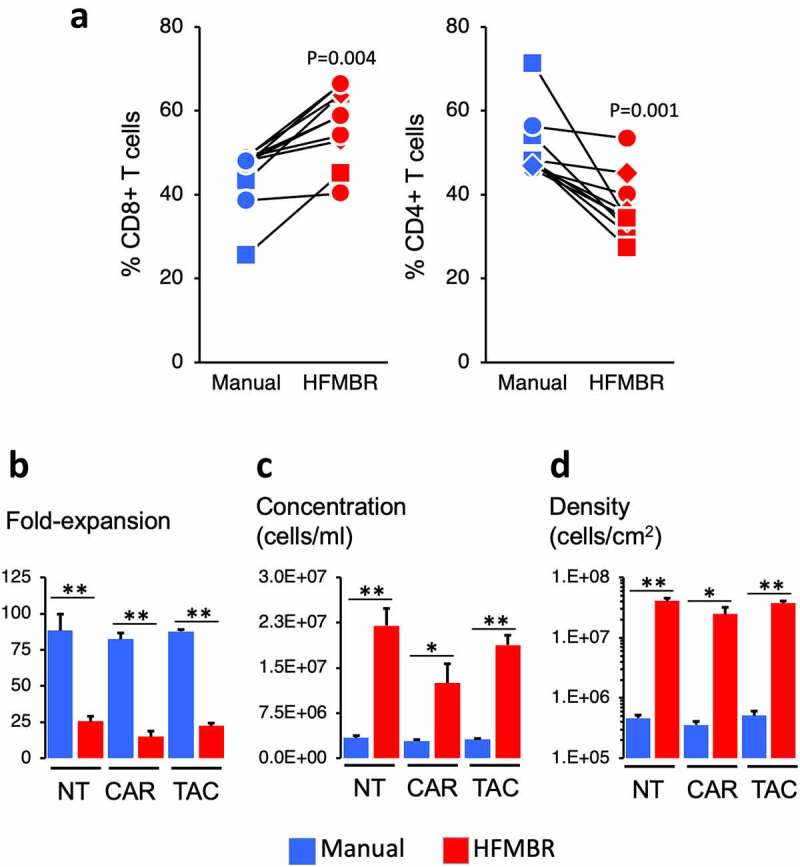
Figure 2.

Properties of the manual and HFMBR cultures. Panel A. At the end of the manufacturing period, the T cells were collected, enumerated and subjected to flow cytometry to determine the relative frequency of CD8 + T cells and CD4 + T cells. The lines denote parallel manual and HFMBR cultures performed on the same day with the same donor. The symbols denote the condition: squares identify NT T cells, circles identify CAR T cells and diamonds identify TAC T cells. P-values were determined using Students t-test. Panels B – D. Fold-expansion, cell concentration and density are shown for the day 10 of culture, which is the day of harvest. * denotes p < .05 and ** denotes p < .01; P-values were determined using Students t-test
