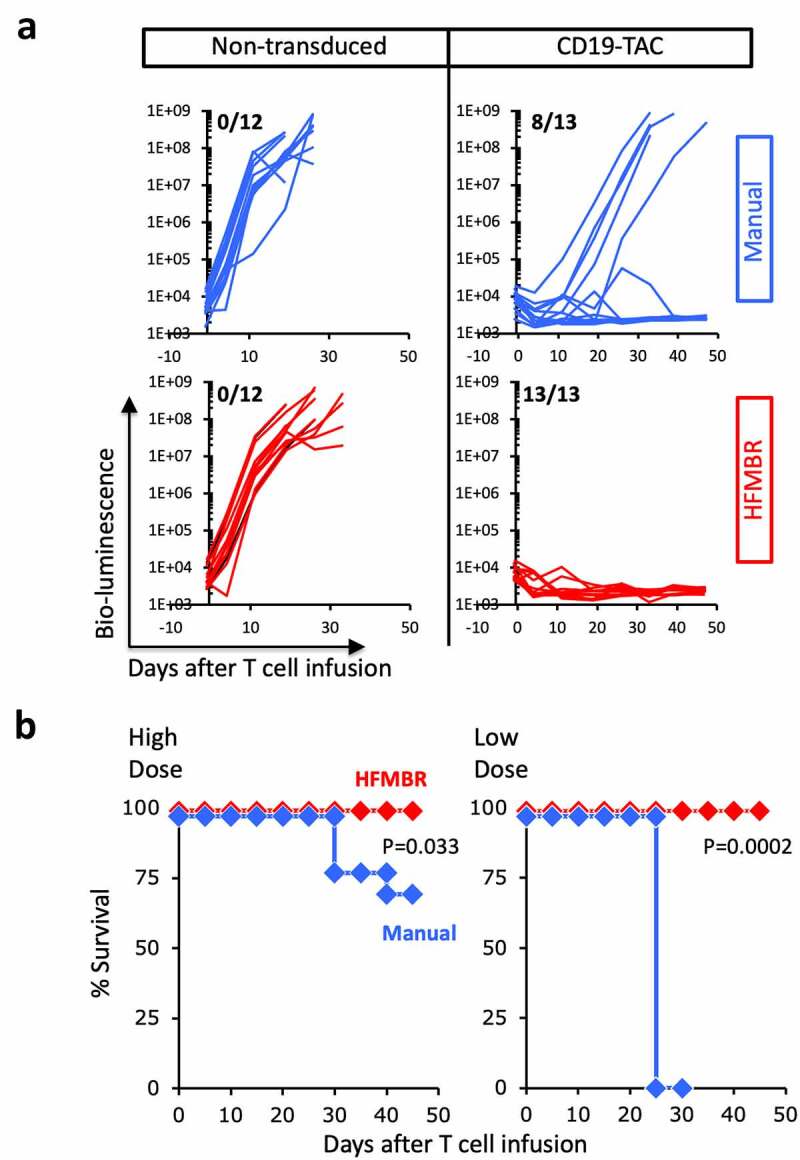
Figure 3.

Therapeutic activity of T cells manufactured using the manual method and HFMBR. PBMC were engineered with CD19-TAC using either the manual method (blue lines and diamonds) or the HFMBR (red lines and diamonds); in parallel, a batch of PBMC was manufactured without virus transduction (non-transduced). Mice bearing NALM-6 xenografts were treated with a high dose (4e6) or low dose (1–1.5e6) of T cells. Tumor growth was monitored by bioluminescence and mouse survival was monitored for 50 days. Panel A. Tumor growth measured by bio-luminescence following treatment with high dose of T cells. Upper left, Non-transduced T cells manufactured using the manual method; Upper right, CD19-TAC-engineered T cells produced using the manual method. Lower left, Non-transduced T cells manufactured using the HFMBR; Lower right, CD19-TAC-engineered T cells produced using the HFMBR. n = 12–13 for each treatment group. The fraction of mice without tumor at the end of the study is displayed in the upper left hand corner of each graph. Panel B. Mouse survival following treatment with CD19-TAC T cells engineered using the manual method or the HFMBR. Left panel, high dose of T cells (n = 13 per treatment group); Right, low dose of T cells (n = 5 for CD19-TAC T cells produced manually, n = 10 for CD19-TAC T cells produced in HFMBR). Red diamonds, T cells produced in HFMBR; Blue diamonds, T cells produced manually. P-values were determined using the Log-rank (Mantel-Cox) test
