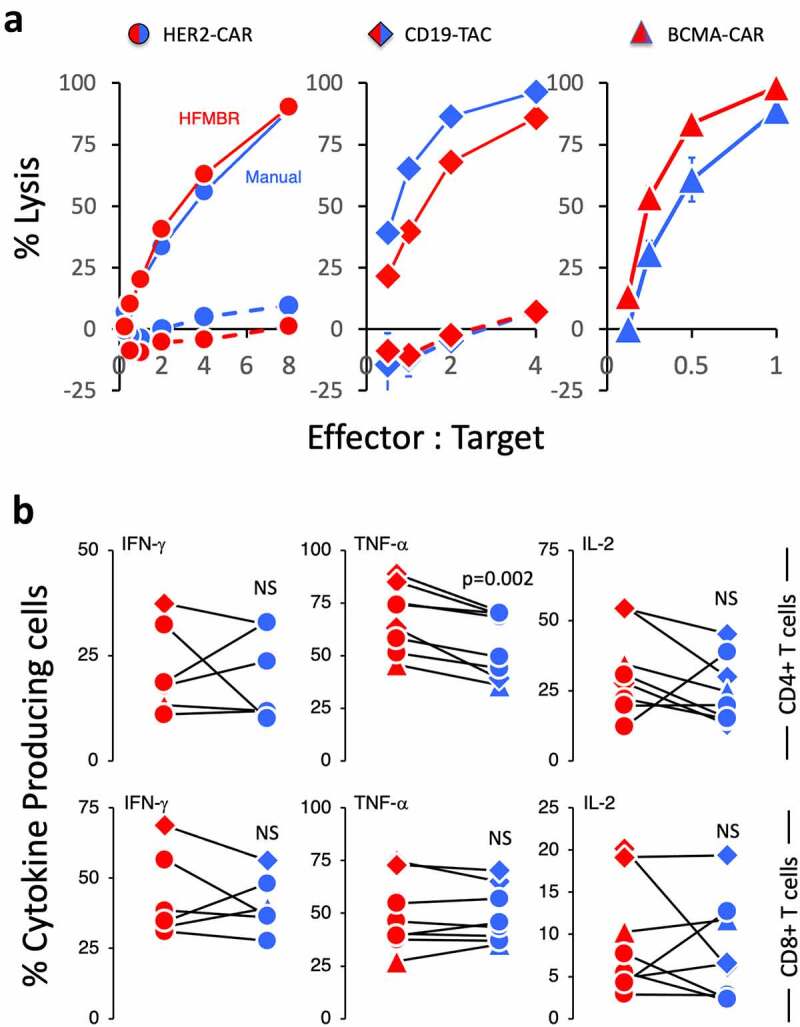
Figure 4.

Functional characterization of the T cell manufactured using the manual method and HFMBR. PBMC were manufactured using either the manual method (blue symbols) or the HFMBR method (red symbols). T cells engineered with either the HER2-CAR (circles), the CD19-TAC (diamonds) or the BCMA-CAR (triangles). To assess antigen-specific response, the engineered T cells were co-cultured with tumor cells expressing the relevant target antigen [SKOV-3 for HER2-CAR-engineered T cells (left-hand panel); NALM-6 for CD19-TAC-engineered T cells (center panel); KMS-11 for BCMA-CAR-engineered T cells (right-hand panel)]. Solid lines represent the CAR/TAC-engineered T cells. Dashed lines represent non-engineered T cells. Panel A. Cytotoxicity was assessed following overnight co-culture. Each product tested was derived from a different donor. Each panel represents an independent experiment and production run. Error bars represent standard error of the mean for technical triplicates. Panel B. The frequency of T cells producing IFN-γ (left-hand panels), TNF-α (central panels) and IL-2 (right-hand panels) was assessed by intracellular cytokine staining following a 4-hour co-culture with tumor cells expressing the relevant antigen target. A total of 8 products generated from 5 different donors were tested. The data were generated from 8 independent experiments. P-values were determined using a paired Students t-test. NS = non-significant
